Zensar stock forming Morning Star Pattern; Check the chart and key details
Alex Smith
4 months ago

Synopsis: Zensar Technologies Ltd displayed a morning star pattern on its 30-minute chart, indicating a possible short-term bullish reversal.
The Morning Star pattern indicates a shift in momentum, with buyers regaining control after recent weakness, suggesting increasing buying interest and reinforcing the potential for a bullish move.
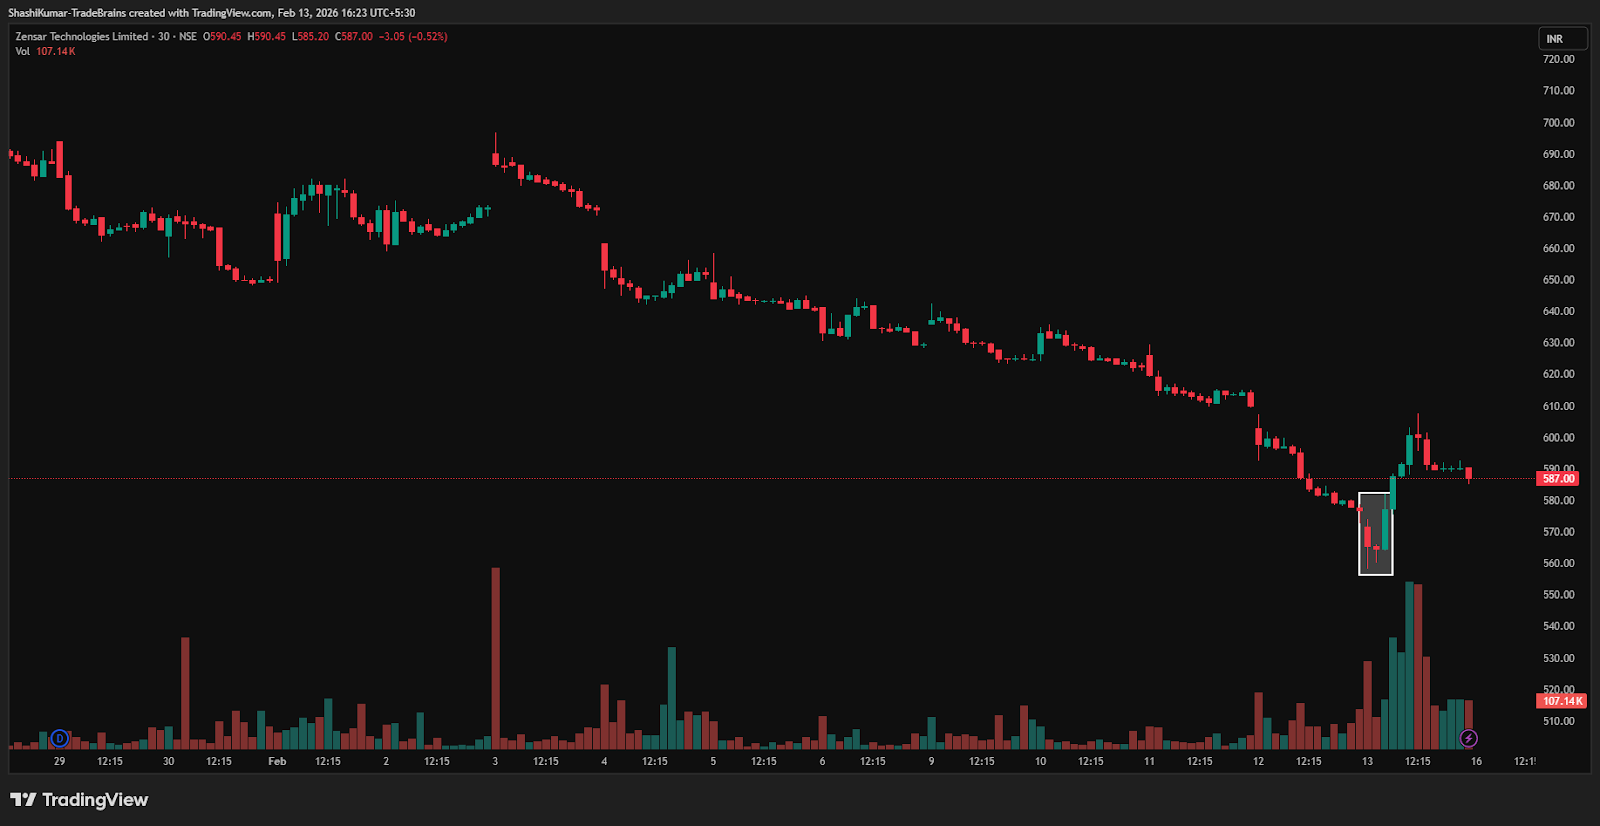
The appearance of a small-bodied candle sandwiched between a preceding bearish candle and a following strong bullish candle highlights a shift in market sentiment, signaling that buyers are reclaiming control.
On Friday, Zensar Technologies Ltd formed a Morning Star pattern on the 30-minute chart. A decisive move above Rs 577 level could pave the way for further gains, whereas a fall below this level would undermine the bullish outlook.
Targets are usually placed near the closest resistance levels above the reversal. Traders often trail profits as the price advances, taking partial or full gains around key resistance zones, while watching price momentum and volume for confirmation or early signs of buying exhaustion.
Zensar Technologies Ltd Chart: 30-minute Timeframe
Indicator Confirmation
- RSI: The daily RSI indicates bullish momentum, as it rose from 22.3 in the previous trading session to 27.2 on Friday, confirming the bullish reversal.
- Price Volume Trend: The Price Volume Indicator confirms the uptrend, accompanied by a sharp increase in buying volume in the daily time frame.
Implications
The formation of a Morning Star pattern points to potential upside for the stock. A sustained move above the key Rs 577 level, preferably on strong buying volumes, would confirm the reversal and reduce the risk of a false signal. Holding above this level would reinforce near-term bullish momentum.
About the stock
Zensar Technologies is a digital solutions company that designs, builds, and manages products using experience design, data engineering, and advanced analytics for 170+ global clients. Leveraging top platforms, it helps clients stay competitive, agile, and transformative. Headquartered in Pune, India, Zensar has 10,500+ employees across 30+ locations, including San Jose, Seattle, Princeton, Cape Town, London, Colombia, and Mexico City.
Over the past month, Zensar Technologies Ltd has fallen 17.72%. The stock is down 26.73% over the last six months and has slipped 32.10% compared to the same period last year.For more such technical stock ideas, clickhereto view our research page.
Disclaimer: The views and investment tips expressed by investment experts/broking houses/rating agencies on tradebrains.in are their own, and not that of the website or its management. Investing in equities poses a risk of financial losses. Investors must therefore exercise due caution while investing or trading in stocks. Trade Brains Technologies Private Limited or the author are not liable for any losses caused as a result of the decision based on this article. Please consult your investment advisor before investing.
The post Zensar stock forming Morning Star Pattern; Check the chart and key details appeared first on Trade Brains.
Related Articles

Netweb Technologies Shares Crash 11% Today; Check the Reason Why
Synopsis: The share of this company fell by nearly 11.3 percent amid concerns of...

Diffusion Engineers Stock Surges 7% on Securing ₹26.31 Cr RAPH Rotor Supply Order
Synopsis: A fresh domestic order worth roughly Rs. 26.31 crore for rotor assembl...

Supreme Industries Stock Crashes 7% After JPMorgan Cuts Its Target Price; Check the Details
Synopsis: Supreme Industries shares fell 7% after JPMorgan downgraded the stock...

Ethereum Has Crashed 66% From Its Highs But What Will It Take To Recover?
Synopsis: Ethereum has dropped nearly 66 percent from its all-time high, raising...