XRP Price Walks a Tightrope As Downside Threat Persists
Alex Smith
2 months ago

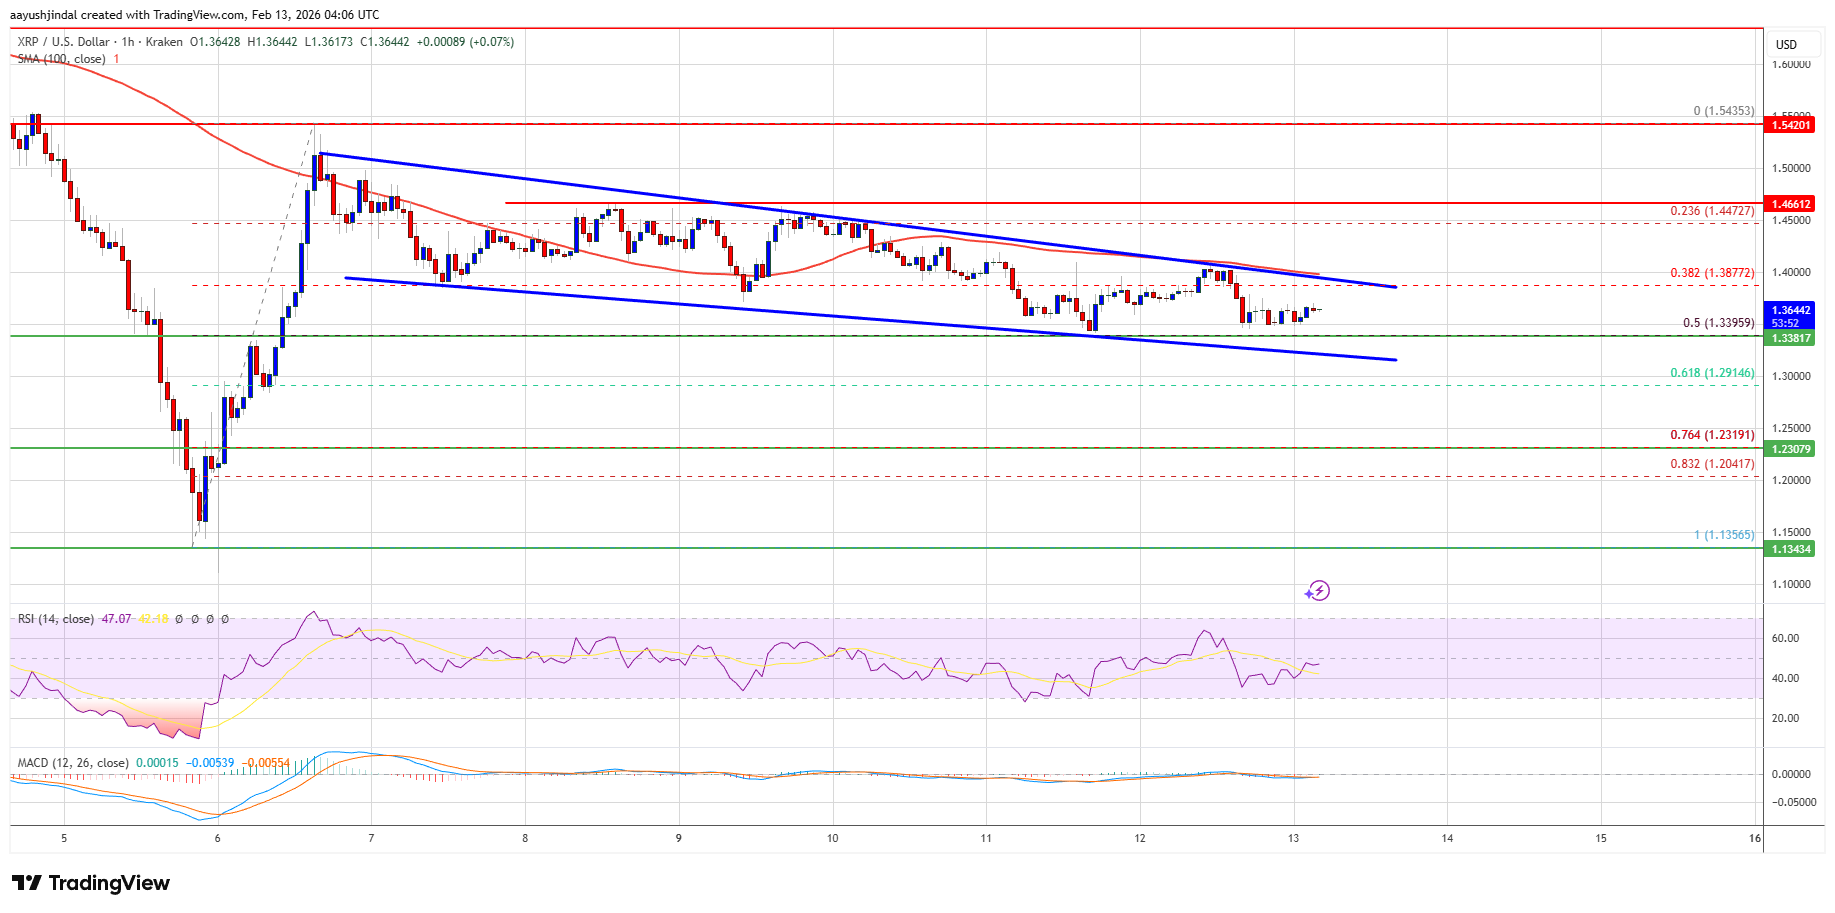
XRP price failed to surpass $1.4650 and started another decline. The price is now correcting gains and might struggle to stay above $1.320.
- XRP price started a downside correction and declined below $1.40.
- The price is now trading below $1.380 and the 100-hourly Simple Moving Average.
- There is a declining channel forming with resistance at $1.3880 on the hourly chart of the XRP/USD pair (data source from Kraken).
- The pair could start another increase if it stays above $1.30.
XRP Price Dips To Support
XRP price failed to stay above $1.4650 and started a downside correction, like Bitcoin and Ethereum. The price dipped below the $1.420 and $1.40 levels to enter a negative zone.
The price even tested the 50% Fib retracement level of the upward move from the $1.1356 swing low to the $1.5435 high. The bulls are now active near the $1.340 zone. Besides, there is a declining channel forming with resistance at $1.3880 on the hourly chart of the XRP/USD pair.
The price is now trading below $1.3850 and the 100-hourly Simple Moving Average. If there is a fresh upward move, the price might face resistance near the $1.3880 level. The first major resistance is near the $1.40 level, above which the price could rise and test $1.420.
A clear move above the $1.420 resistance might send the price toward the $1.450 resistance. Any more gains might send the price toward the $1.4820 resistance. The next major hurdle for the bulls might be near $1.50.
Downside Continuation?
If XRP fails to clear the $1.40 resistance zone, it could start a fresh decline. Initial support on the downside is near the $1.340 level. The next major support is near the $1.30 level or the 61.8% Fib retracement level of the upward move from the $1.1356 swing low to the $1.5435 high at $1.2920.
If there is a downside break and a close below the $1.2920 level, the price might continue to decline toward $1.2650. The next major support sits near the $1.250 zone, below which the price could continue lower toward $1.2250.
Technical Indicators
Hourly MACD – The MACD for XRP/USD is now gaining pace in the bearish zone.
Hourly RSI (Relative Strength Index) – The RSI for XRP/USD is now below the 50 level.
Major Support Levels – $1.340 and $1.2920.
Major Resistance Levels – $1.3880 and $1.40.
Related Articles
Alibaba AI Model Puts XRP Price Between $7 And $42 By Year-End
An artificial intelligence model developed by Alibaba has projected that XRP cou...

This Pattern Suggests Ethereum Is In Accumulation Phase — What’s Next?
The price of Ethereum has somewhat slowed down over the weekend after a breakdow...

Bitcoin Shows Classic ‘Wall Of Worry’ Rally As Retail Lags Behind
A recent on-chain analysis suggests that Bitcoin is once again showing divergenc...
SuperTrend Flips Bullish On XRP Daily Chart — But Key $1.55 Resistance Awaits
The XRP market has recorded a major positive development, as the SuperTrend flas...