XRP Price Range-Bound Below $1.50, Break Or Breakdown Ahead?
Alex Smith
2 months ago
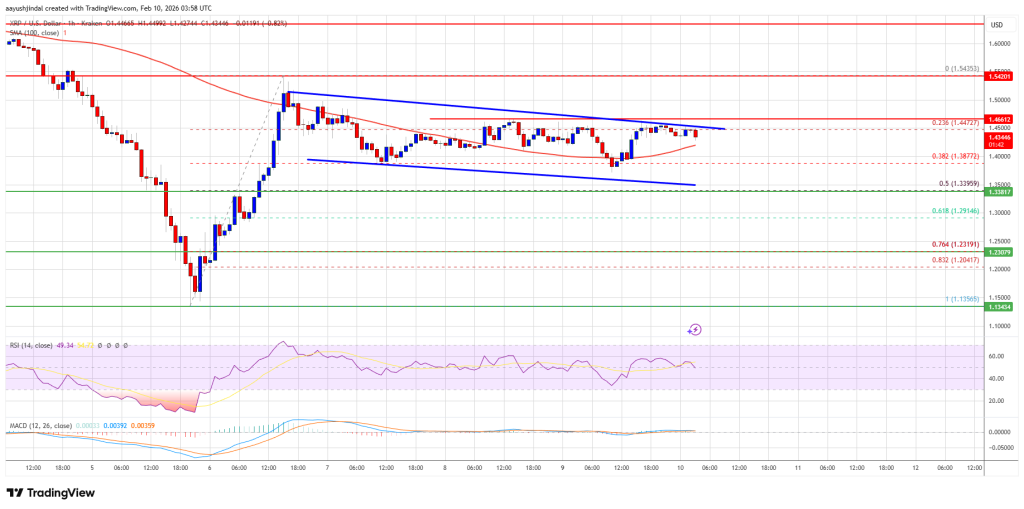
XRP price started a decent increase above $1.420. The price is now consolidating gains and might aim for more gains above the $1.50 zone.
- XRP price started a decent upward move above the $1.40 zone.
- The price is now trading above $1.40 and the 100-hourly Simple Moving Average.
- There is a declining channel forming with support at $1.350 on the hourly chart of the XRP/USD pair (data source from Kraken).
- The pair could continue to move up if it settles above $1.50.
XRP Price Faces Hurdles
XRP price started a recovery wave above $1.380 and $1.40, like Bitcoin and Ethereum. The price gained pace for a clear move above the $1.450 resistance.
The bulls even pumped the price above the $1.50 zone. A high was formed at $1.5435 and the price started a consolidation phase. There was a drop below the 23.6% Fib retracement level of the upward move from the $1.135 swing low to the $1.543 high.
The price is now trading above $1.40 and the 100-hourly Simple Moving Average. Besides, there is a declining channel forming with support at $1.350 on the hourly chart of the XRP/USD pair.
If there is a fresh upward move, the price might face resistance near the $1.450 level. The first major resistance is near the $1.50 level, above which the price could rise and test $1.5450. A clear move above the $1.5450 resistance might send the price toward the $1.650 resistance. Any more gains might send the price toward the $1.720 resistance. The next major hurdle for the bulls might be near $1.80.
Another Decline?
If XRP fails to clear the $1.50 resistance zone, it could start a fresh decline. Initial support on the downside is near the $1.40 level. The next major support is near the $1.340 level or the 50% Fib retracement level of the upward move from the $1.135 swing low to the $1.543 high.
If there is a downside break and a close below the $1.340 level, the price might continue to decline toward $1.30. The next major support sits near the $1.250 zone, below which the price could continue lower toward $1.20.
Technical Indicators
Hourly MACD – The MACD for XRP/USD is now losing pace in the bullish zone.
Hourly RSI (Relative Strength Index) – The RSI for XRP/USD is now above the 50 level.
Major Support Levels – $1.40 and $1.340.
Major Resistance Levels – $1.450 and $1.50.
Related Articles
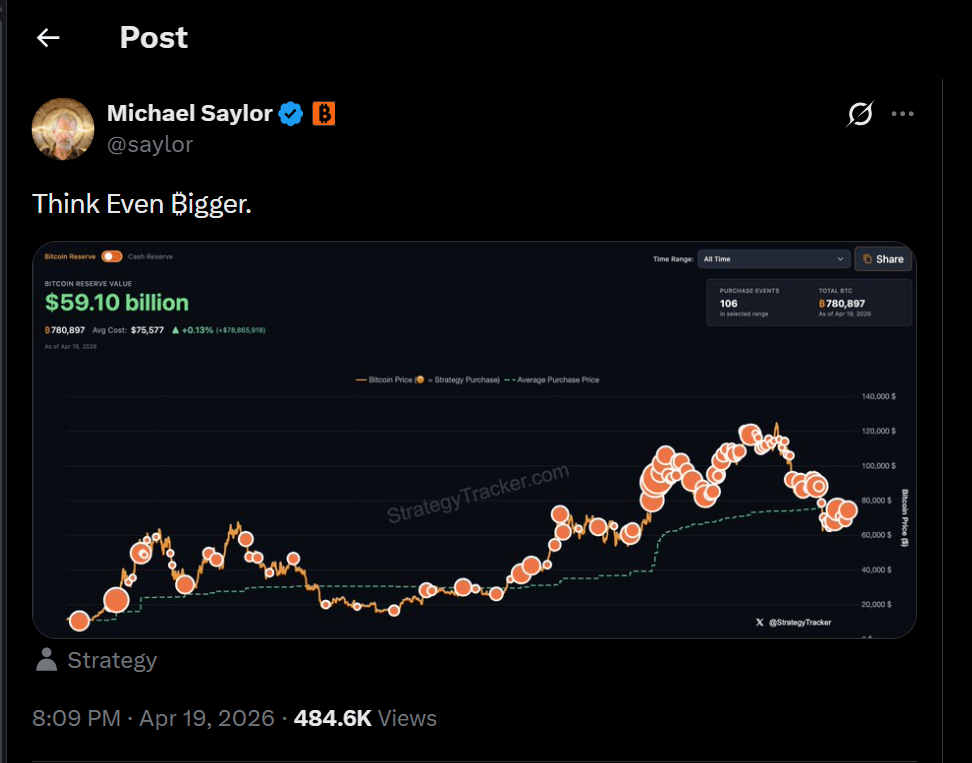
Strategy Raises $1.76B War Chest As Saylor Signals Bigger Bitcoin Buy
Michael Saylor’s company has already lined up the money. Now the question...
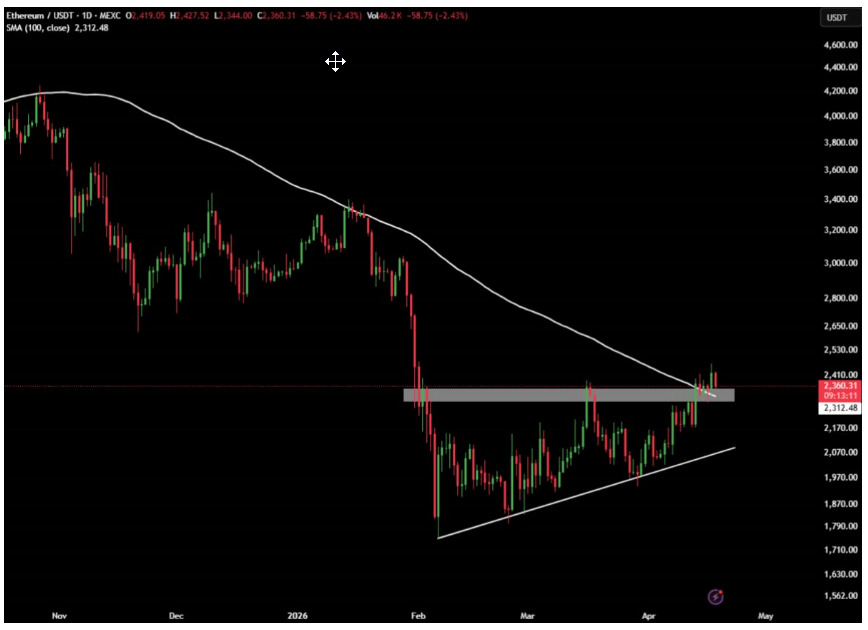
Ethereum Flips Key Resistance, ETF Demand Returns, Analysts Eye Next Leg Higher
Ethereum is flashing a combination of technical and on-chain signals that analys...
Bitcoin Miner Pain Reaches Critical Threshold — Impact On Price
According to data from a recent on-chain evaluation, the Bitcoin mining sector i...
Alibaba AI Model Puts XRP Price Between $7 And $42 By Year-End
An artificial intelligence model developed by Alibaba has projected that XRP cou...