XRP Price Hovers at Key Support, Fueling Debate Over Incoming Breakout
Alex Smith
6 months ago
XRP price started a fresh decline below $2.10. The price is now struggling and faces resistance near the $2.050 pivot level.
- XRP price started a fresh decline below the $2.050 zone.
- The price is now trading below $2.050 and the 100-hourly Simple Moving Average.
- There is a bearish trend line forming with resistance at $2.120 on the hourly chart of the XRP/USD pair (data source from Kraken).
- The pair could continue to move down if it settles below $2.00.
XRP Price Dips Again
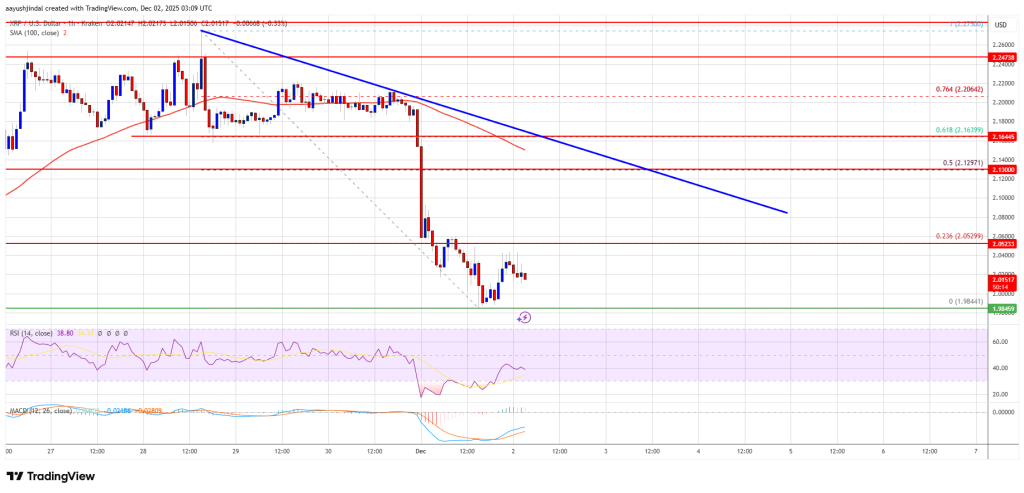
XRP price attempted a recovery wave above $2.150 but failed to continue higher, like Bitcoin and Ethereum. The price started a fresh decline below $2.10 and $2.050.
There was a move below the $2.00 support level. A low was formed at $1.984, and the price is now consolidating losses below the 23.6% Fib retracement level of the downward move from the $2.275 swing high to the $1.984 low.
The price is now trading below $2.050 and the 100-hourly Simple Moving Average. If there is a fresh upward move, the price might face resistance near the $2.050 level. The first major resistance is near the $2.120 level. There is also a bearish trend line forming with resistance at $2.120 on the hourly chart of the XRP/USD pair. It is near the 50% Fib retracement level of the downward move from the $2.275 swing high to the $1.984 low.
A close above $2.120 could send the price to $2.20. The next hurdle sits at $2.250. A clear move above the $2.250 resistance might send the price toward the $2.2850 resistance. Any more gains might send the price toward the $2.350 resistance. The next major hurdle for the bulls might be near $2.40.
More Losses?
If XRP fails to clear the $2.050 resistance zone, it could start a fresh decline. Initial support on the downside is near the $2.00 level. The next major support is near the $1.9850 level.
If there is a downside break and a close below the $1.9850 level, the price might continue to decline toward $1.920. The next major support sits near the $1.880 zone, below which the price could continue lower toward $1.820.
Technical Indicators
Hourly MACD – The MACD for XRP/USD is now losing pace in the bearish zone.
Hourly RSI (Relative Strength Index) – The RSI for XRP/USD is now below the 50 level.
Major Support Levels – $2.00 and $1.9850.
Major Resistance Levels – $2.050 and $2.120.
Related Articles

Zcash Fixes Critical Orchard Vulnerability As ZEC Holds $600 Support
Zcash has patched a dangerous vulnerability in its privacy-focused infrastructur...

Bitcoin Falls Below $66K As Short-Term Holder Stress Reaches February Levels
Bitcoin has lost the $66,000 level as selling pressure and uncertainty intensify...

XRP Already Powers Real Banking Activity, Says Evernorth, With More Growth Expected
Evernorth says daily activity on the XRP Ledger has climbed to nearly 3 million...
Crypto Is A ‘Failed’ Asset Class, Says Renowned Economist
Economist and macro trader Alex Krüger has argued that “crypto” has largely fail...