XRP Flashes Rare On-Chain Signal As Massive Exchange Outflow Spike Emerges
Alex Smith
1 month ago
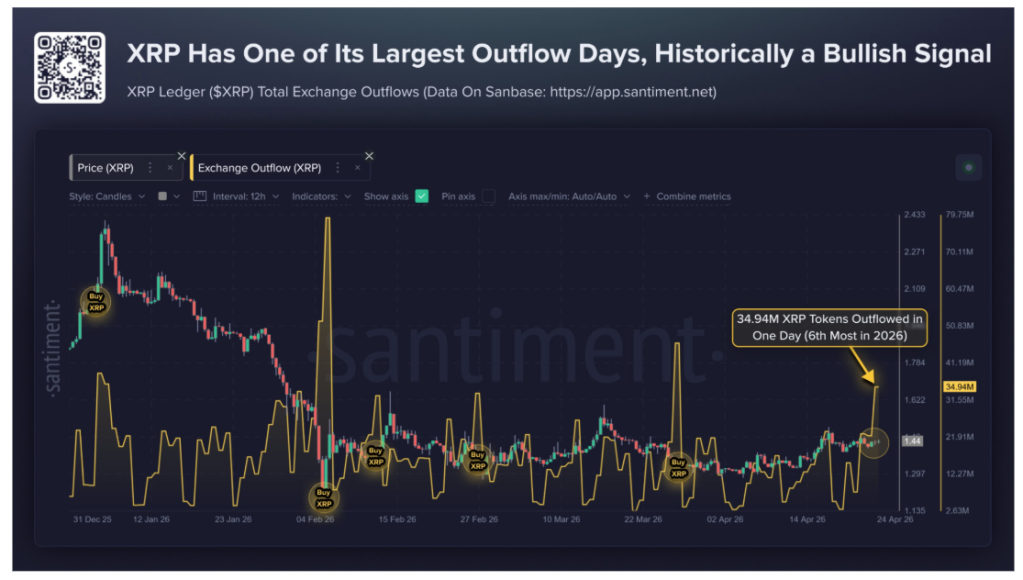
XRP has entered the final stretch of April with one of its strongest on-chain accumulation signals of the year. Data from Santiment shows that 34.94 million XRP left exchanges in a single 24-hour period on April 24, making it the sixth-largest exchange outflow day recorded so far in 2026.
The move comes as XRP is trading around $1.43, having clawed back from the $1.30 levels that defined much of early April.
Millions Of XRP Leave Exchanges In Major On-Chain Signal
Exchange outflows measure the volume of tokens being withdrawn from trading platforms into private wallets, and this is a bullish move that shows holder intent to accumulate their tokens.
According to data from on-chain analytics platform Santiment, XRP investors recently went through one of their highest 24-hour accumulations from crypto exchanges so far this year. Notably, Santiment’s data shows that XRP’s latest outflow spike reached 34.94 million tokens in one day. These 34.94 million XRP tokens that flowed off exchanges rank as the sixth-largest such event within 2026 alone.
Santiment’s XRP exchange outflow chart shows that each of the largest outflow spikes this year, occurring in early January, late January, early February, late February, and late March, was subsequently accompanied by bullish price action. In each instance, the drawdown in exchange-held supply gave way to a price recovery within days.
XRP Exchange Outflows. Source: @santimentfeed On X
XRP Entering Wave 3 Expansion Setup
While on-chain data is pointing to accumulation, technical analysis from crypto analyst EGRAG CRYPTO laid out a macro-level Elliott Wave framework on the monthly chart that could guide XRP’s price trajectory through 2026 and into 2027.
The guide is based on the monthly 50 EMA, which XRP is currently holding as support. According to EGRAG, price wicked down to the 100 EMA on the monthly timeframe in the previous market cycle before recovering. However, this cycle is unlikely to repeat that depth.
As it stands, the 50 EMA is the primary accumulation zone, while any wick to the 100 EMA would represent what the analyst describes as a rare, once-in-a-cycle entry opportunity. The 100 EMA is currently around the $0.96 price level.
The analyst’s bigger contention is that XRP may be moving from Wave 2 correction into Wave 3 expansion. Wave 1 constituted XRP’s initial breakout to new all-time highs in 2025, Wave 2 is the correction that the price is completing now, and Wave 3 is the expansion phase that’s about to kick off.
XRP Price Chart. Source: @egragcrypto On X
In Elliott Wave analysis, Wave 3 is often treated as the strongest part of a trend. The monthly chart maps Wave 3 targets using the 1.618 Fibonacci extension of Wave 1, with a projected range between $15 and $31 if the price action plays out this way.
Featured image from Unsplash, chart from TradingView
Related Articles
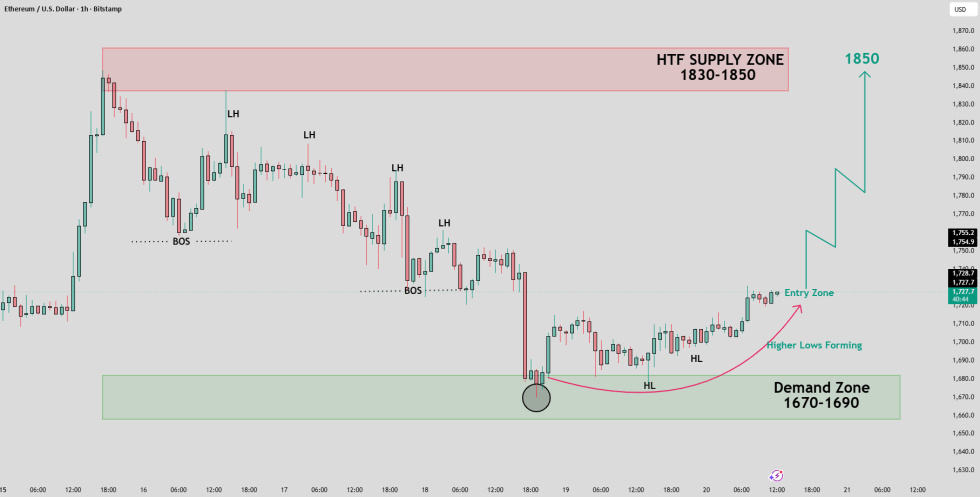
Ethereum Price Setup Targets $1,850 As Buyers Defend Key Demand Zone
A TradingView analyst says Ethereum could target $1,850 if buyers defend the $1,...
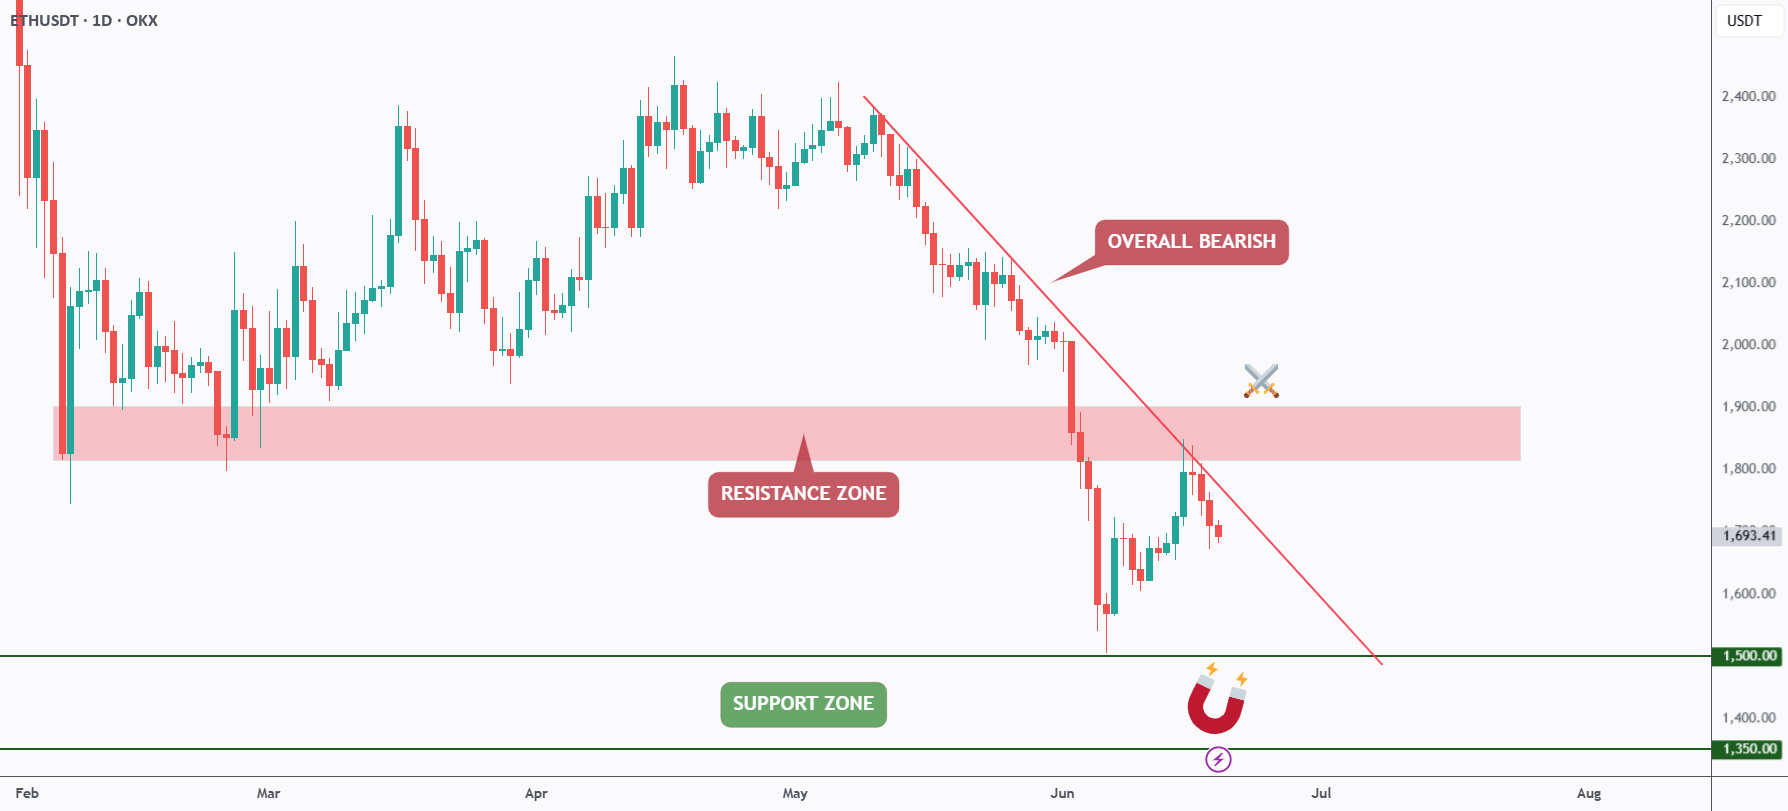
Ethereum Bears Keep Control As ETH Rejects Trendline Resistance
A TradingView analyst says Ethereum remains bearish below a falling trendline, w...
ETH/BTC Ratio Falls Back To Early-2023 Levels As Traders Debate Ethereum Value
An X analyst says ETH/BTC is back near 0.027, while a TradingView chart shows ET...
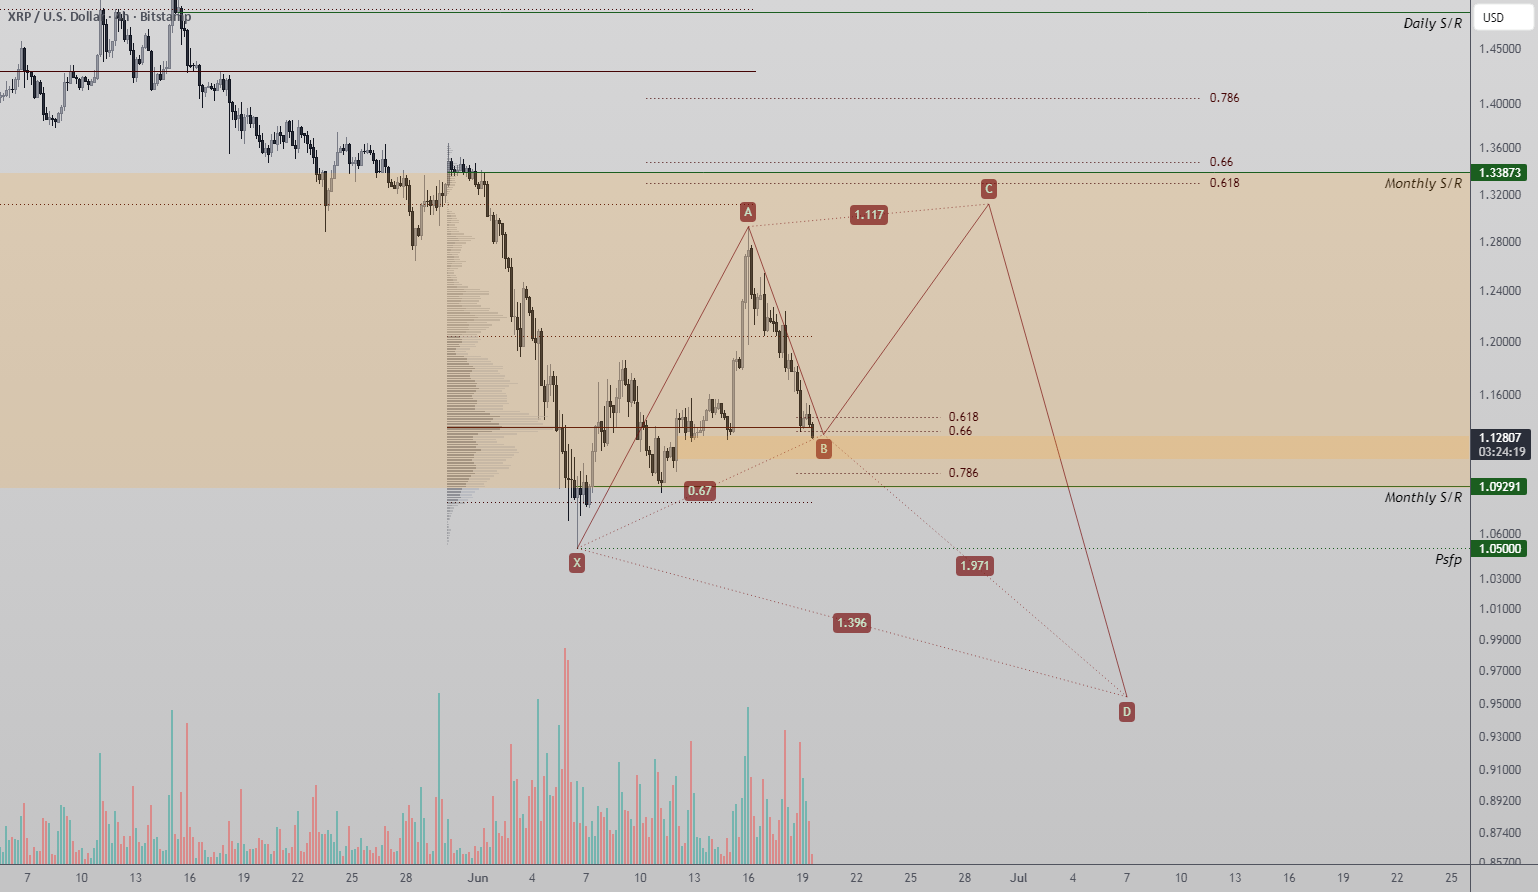
XRP Reversal Setup Forms Around Harmonic Pattern And Key Support Zone
A TradingView analyst says XRP is testing a technically important support zone s...