XRP Enters Phase 4 In Long-Term Chart Structure: Road To $21.5 Now Open
Alex Smith
5 months ago
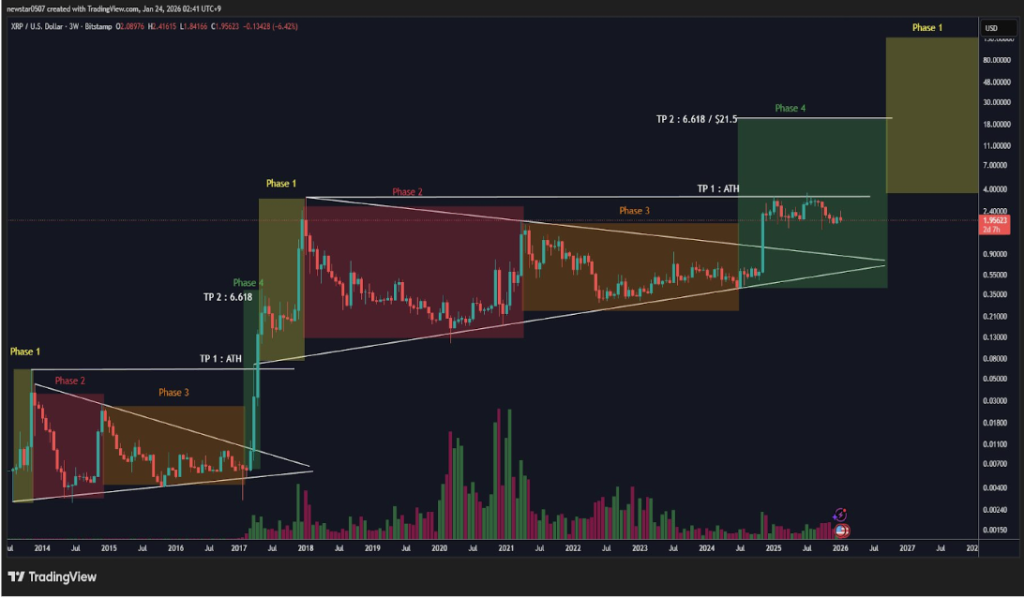
Technical analysis of XRP’s price action on the 3-week candlestick timeframe chart shows that the cryptocurrency is about to play out a road to the double-digit threshold based on its long-term structure.
The analysis, which was shared on the social media platform X alongside a multiyear chart, points to XRP trading in what is labeled Phase 4. At the center of this setup is a clear technical target of a break above the previous all-time high and a run to at least $21.5
XRP Price Action In Phases
Technical analysis of XRP price action shows that the cryptocurrency has been trading in a series of four phases for more than a decade. One full sequence of four phases unfolded between mid-2013 and mid-2017 as the foundation for XRP’s first rally to price peaks. Since then, a second set of four phases has been developing and following a similar pattern.
XRP transitioned into a new phase 1 and phase 2 sequence that led to a 2018 peak for phase 1 and then a pullback for phase 2 between 2018 and 2020. This was followed by an unusually long p3 that stretched from 2019 to mid-2024, visible on the chart as a broad, multi-year consolidation with converging trendlines of lower highs and higher lows. During this time, XRP’s price action was trapped inside the compression structure, just like the behavior seen during phase 3 of the first cycle.
XRP Price Chart. Source: @amonyx On X
Phase 4 Returns: XRP To Double Digits
According to the technical analysis, phase 4 began in 2025, when XRP finally broke above the compression range in mid-2024. This breakout was the same structural transition seen in mid-2017, when XRP exited consolidation and entered expansion.
Phase 4 has already been in progress for several months and includes the period when XRP rallied to new all-time highs in mid-2025, eventually topping out at $3.65 in July. Since that peak, however, XRP’s price action has been playing out a corrective downward trend and is down by roughly 48% at the time of writing.
Despite the ongoing correction, the projection is that XRP is still in phase 4 and is going to break into new all-time highs soon. This shows that phase 4 could unfold over an extended period and not with a single impulse move. The current all-time high of $3.65 is the first major technical hurdle, and a break above it will serve as confirmation that XRP is back into price discovery.
Based on this technical analysis, past expansion ratios from the previous cycle are applied and a 6.618 Fibonacci extension is measured from the phase 3 support low. This points to a projected price level near $21.5. At the time of writing, XRP is trading at $1.89, meaning a move to that level would represent an increase of roughly 1,040% from current prices.
Featured image from Pexels, chart from TradingView
Related Articles

Bitcoin Bears Eye Lower Levels As TradingView Analysts Flag Failed Recovery
TradingView analysts warn Bitcoin's rebound may still be a resistance retest as...

Bitcoin Reclaims $63,500 As Traders Watch For Squeeze Toward $67,000
Bitcoin bulls are watching the $63,500 support zone as traders map a potential s...

Bitcoin Analysts Split Between Buyer Demand And Resistance Ceiling Near $65,000
Bitcoin analysts are split as BTC shows buyer demand but still faces a resistanc...

Bitcoin Faces Key $64,100 Resistance As Analyst Watches Fib Reaction Zone
An X analyst says Bitcoin is approaching local H4 resistance near $64,100, a lev...