Wall Street’s Bitcoin Exit Door: How Institutional Depth Allowed LTH To Distribute Record Supply
Alex Smith
4 months ago

Bitcoin is struggling to push decisively above the $69,000 level as persistent selling pressure and rising market anxiety continue to weigh on sentiment. After several failed breakout attempts, price action reflects a cautious environment in which traders remain hesitant to commit fresh capital. Volatility has increased alongside deteriorating confidence, reinforcing the perception that the market is still navigating a corrective phase rather than entering a sustained recovery.
A recent report from analyst Darkfost provides additional context through on-chain data, particularly the Coin Days Destroyed (CDD) heatmap. This indicator measures the number of holding days accumulated by each Bitcoin before it is spent, offering insight into the behavior of long-term holders. When visualized as a heatmap, CDD highlights periods when older coins move, allowing analysts to quickly assess shifts in conviction among historically resilient investors.
Compared with previous cycles, the current market phase appears notable for the elevated activity of long-term holders. The data suggests that this cohort has been more active than in past cycles, potentially contributing to supply dynamics that influence price stability. Whether this reflects strategic redistribution, profit-taking, or broader market repositioning remains a key question for investors monitoring Bitcoin’s next directional move.
Long-Term Holder Activity Adds Complexity To Bitcoin’s Market Signals
According to Darkfost, elevated long-term holder activity has historically intensified near market tops, suggesting that distribution from this cohort has often contributed to the formation of local peaks. When older coins begin moving after extended dormancy, it frequently reflects profit-taking or portfolio rebalancing, both of which can increase available supply and weigh on short-term price stability. In prior cycles, similar spikes in Coin Days Destroyed coincided with phases of overheated sentiment and subsequent corrective moves.
However, interpreting this cycle requires additional nuance. Not all increases in long-term holder activity necessarily signal outright selling pressure. Some of the recent CDD spikes appear linked to operational factors rather than directional positioning. Large entities, including Coinbase and Fidelity Investments, have conducted UTXO consolidation transactions, which can artificially inflate activity metrics without representing net supply entering the market.
Technical changes within the Bitcoin ecosystem have also played a role. The growth of Ordinals and inscription-related activity has encouraged some long-standing holders to migrate funds from legacy addresses toward SegWit or Taproot formats, generating on-chain activity that may distort traditional behavioral signals.
At the same time, deeper institutional liquidity has made it easier for long-term holders to distribute positions gradually, potentially smoothing market impact compared with previous cycles.
Bitcoin Faces Key Technical Test Below Major Moving Averages
Bitcoin’s weekly price structure continues to reflect sustained selling pressure, with the asset struggling to stabilize after losing the $70,000 psychological threshold. The chart shows a decisive breakdown from the late-2025 highs near the $120,000 region, followed by a sequence of lower highs and lower lows that typically characterize a corrective market phase rather than simple consolidation.
Price is now trading below the shorter-term moving average, which has rolled over and is beginning to act as dynamic resistance. The intermediate trend average is also flattening, suggesting weakening bullish momentum, while the longer-term average remains upward sloping but distant from current price levels. This configuration often appears during transitional phases where the market shifts from expansion toward redistribution.
Volume patterns reinforce the defensive tone. Recent selloffs have been accompanied by elevated trading activity, indicating active distribution rather than passive drift lower. However, participation has moderated slightly following the most recent drop, which may hint at temporary seller exhaustion.
From a technical standpoint, the $65,000–$68,000 region represents immediate support. Failure to hold this zone could expose deeper retracement levels closer to long-term trend support, while a sustained reclaim of $70,000 would be required to stabilize sentiment and reopen the path toward recovery.
Featured image from ChatGPT, chart from TradingView.com
Related Articles
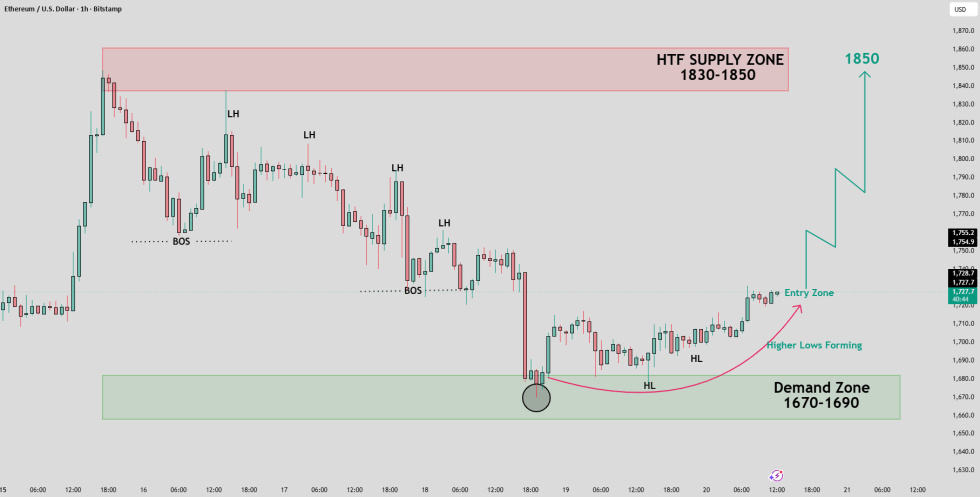
Ethereum Price Setup Targets $1,850 As Buyers Defend Key Demand Zone
A TradingView analyst says Ethereum could target $1,850 if buyers defend the $1,...
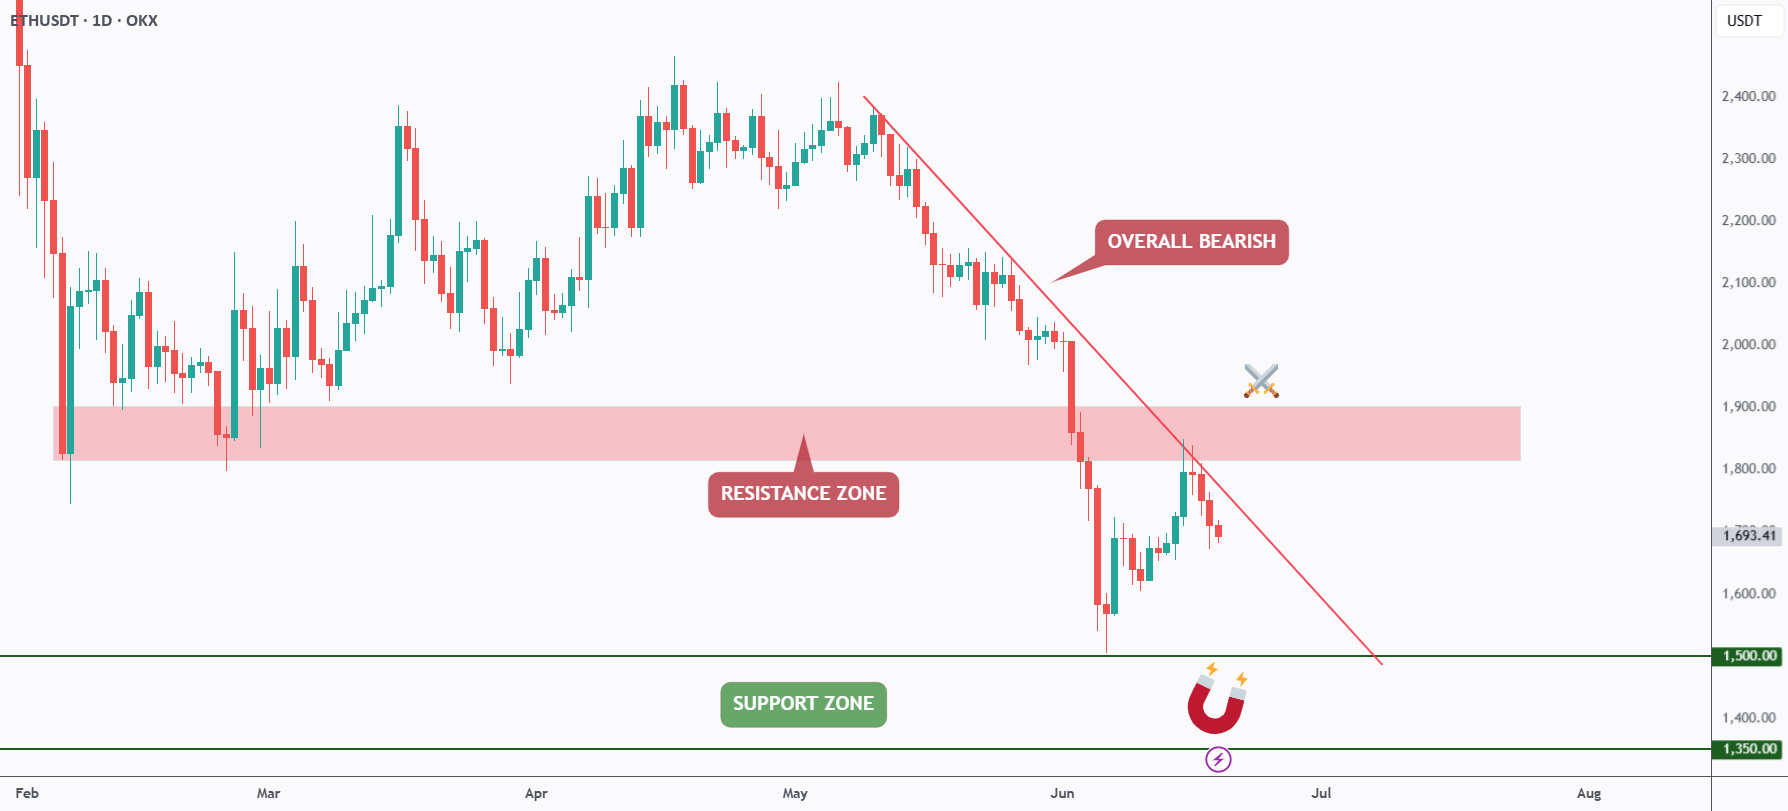
Ethereum Bears Keep Control As ETH Rejects Trendline Resistance
A TradingView analyst says Ethereum remains bearish below a falling trendline, w...
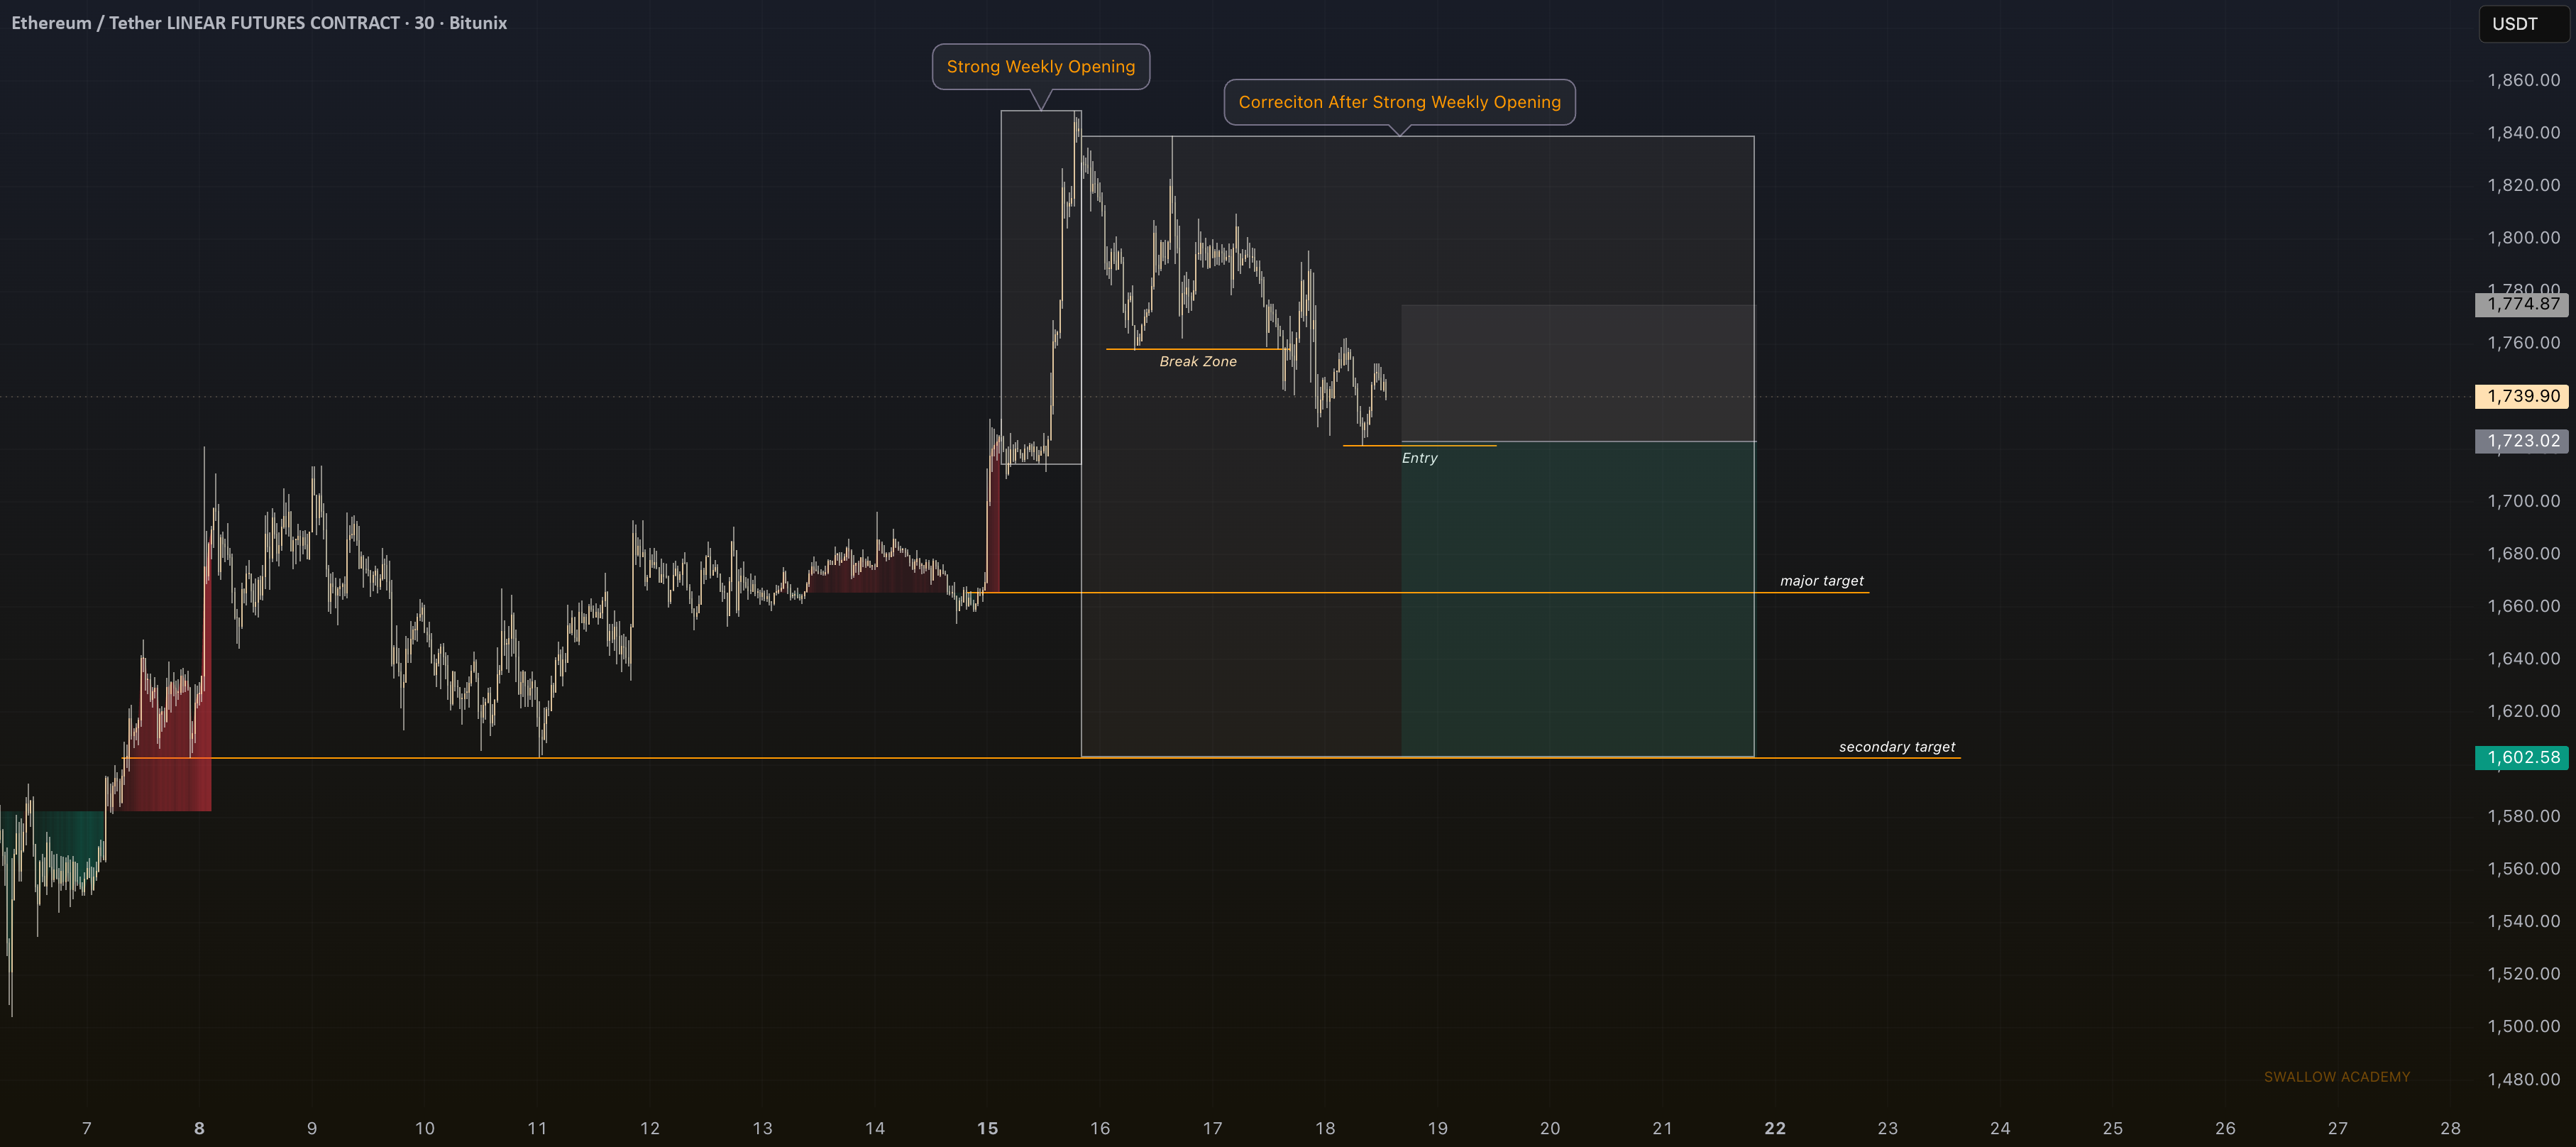
ETH/BTC Ratio Falls Back To Early-2023 Levels As Traders Debate Ethereum Value
An X analyst says ETH/BTC is back near 0.027, while a TradingView chart shows ET...
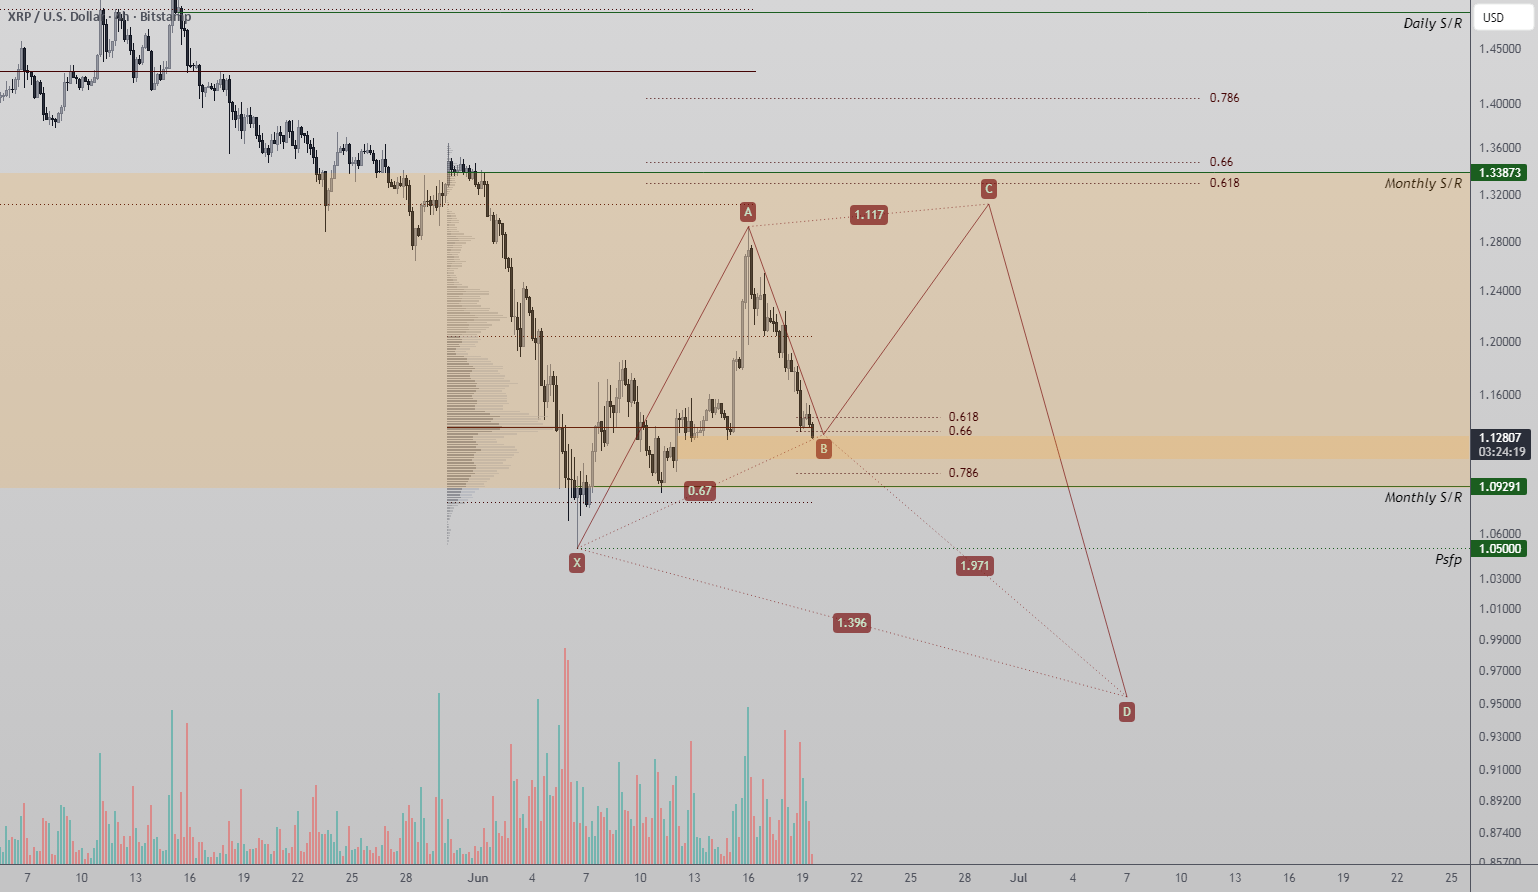
XRP Reversal Setup Forms Around Harmonic Pattern And Key Support Zone
A TradingView analyst says XRP is testing a technically important support zone s...