USDC Exchange Inflows Spike To $778M—Largest Since Bitcoin’s ATH
Alex Smith
2 months ago

On-chain data shows the Exchange Inflow indicator has shot up for USDC, something that could be relevant for Bitcoin and other digital assets.
USDC Exchange Inflow Has Hit The Highest Level In Months
As highlighted by CryptoQuant community analyst Maartunn in a new post on X, the Exchange Inflow recently observed a surge for Circle’s stablecoin, USDC. The “Exchange Inflow” here is an indicator that keeps track of the total amount of a given asset that’s being transferred to wallets connected to centralized exchanges.
Generally, one of the main reasons why investors deposit their tokens to these platforms is for selling-related purposes, so a spike in the metric can indicate elevated demand for swapping the cryptocurrency. In the case of assets like Bitcoin, this can naturally have a bearish effect on the price.
For a stablecoin like USDC, however, there is no such effect as its price is by definition stable around the $1 mark. That said, exchange inflows related to the asset can still matter for the wider sector.
Often, investors stash their capital away in the form of these fiat-tied tokens when they want to wait for an opportune moment to enter the volatile side. Once traders feel that the time is right, they deposit their stablecoins to exchanges, swapping them for Bitcoin or any digital asset of their choice. This shifting can naturally provide a buying boost to the target cryptocurrency.
As the chart below, shared by Maartunn, shows, the USDC Exchange Inflow has observed a massive spike during the past day, implying exchanges have received a large amount of the stablecoin.
The latest deposit spree has seen the inflow of 778,566,191.65 USDC, the largest level since September 2025. Back then, the large spike led into Bitcoin’s run to the new all-time high (ATH) above $126,000 in early October. It now remains to be seen whether the new surge in the indicator is a sign of market buying.
Since stablecoins are often used for injecting capital into the volatile side of the sector, their supply is considered as a measure of the sector’s liquidity waiting on the sidelines. An indicator called the Stablecoin Supply Ratio (SSR) compares the market cap of Bitcoin against this liquidity to estimate how much room the cryptocurrency might have to grow.
As the analyst pointed out in another X post, the Relative Strength Index (RSI) of the BTC SSR has declined into the green zone recently.
Based on the trend, Maartunn explained, “There is still a large amount of stablecoin liquidity relative to Bitcoin’s market cap, suggesting buying power remains on the sidelines.”
BTC Price
At the time of writing, Bitcoin is trading around $66,600, up 1% over the last 24 hours.
Related Articles
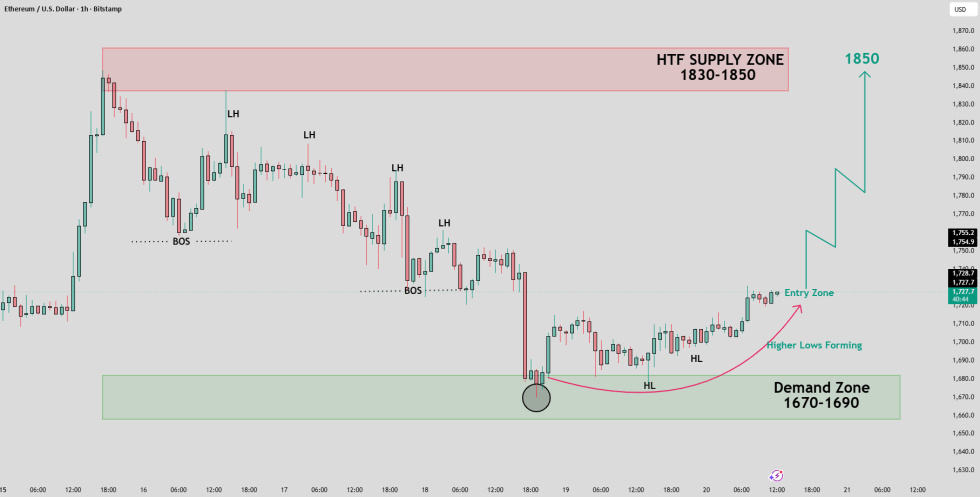
Ethereum Price Setup Targets $1,850 As Buyers Defend Key Demand Zone
A TradingView analyst says Ethereum could target $1,850 if buyers defend the $1,...
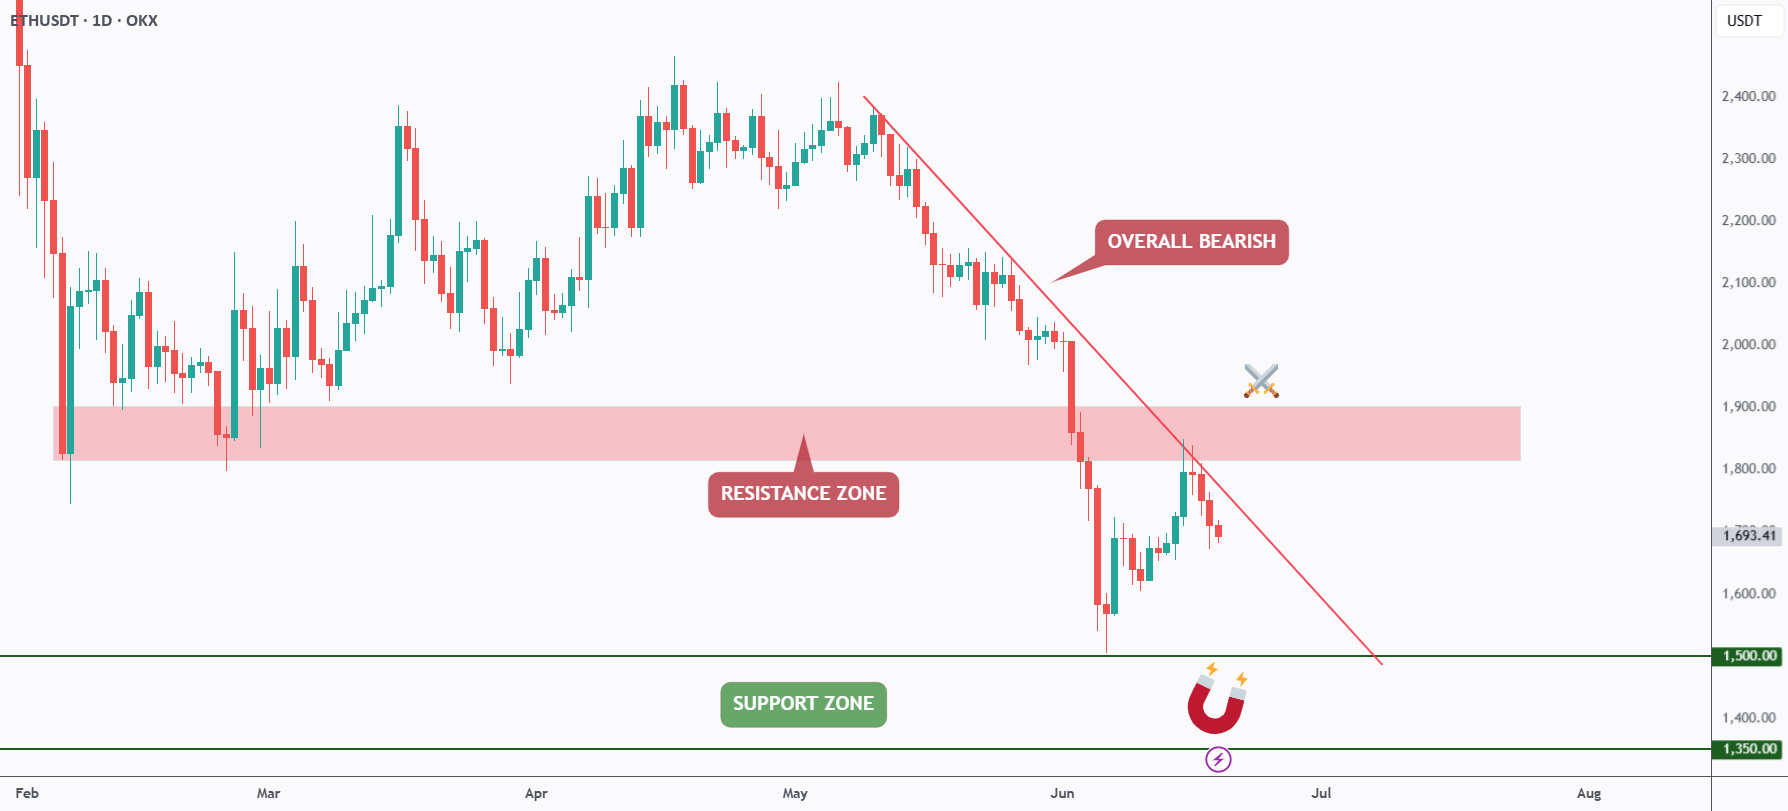
Ethereum Bears Keep Control As ETH Rejects Trendline Resistance
A TradingView analyst says Ethereum remains bearish below a falling trendline, w...
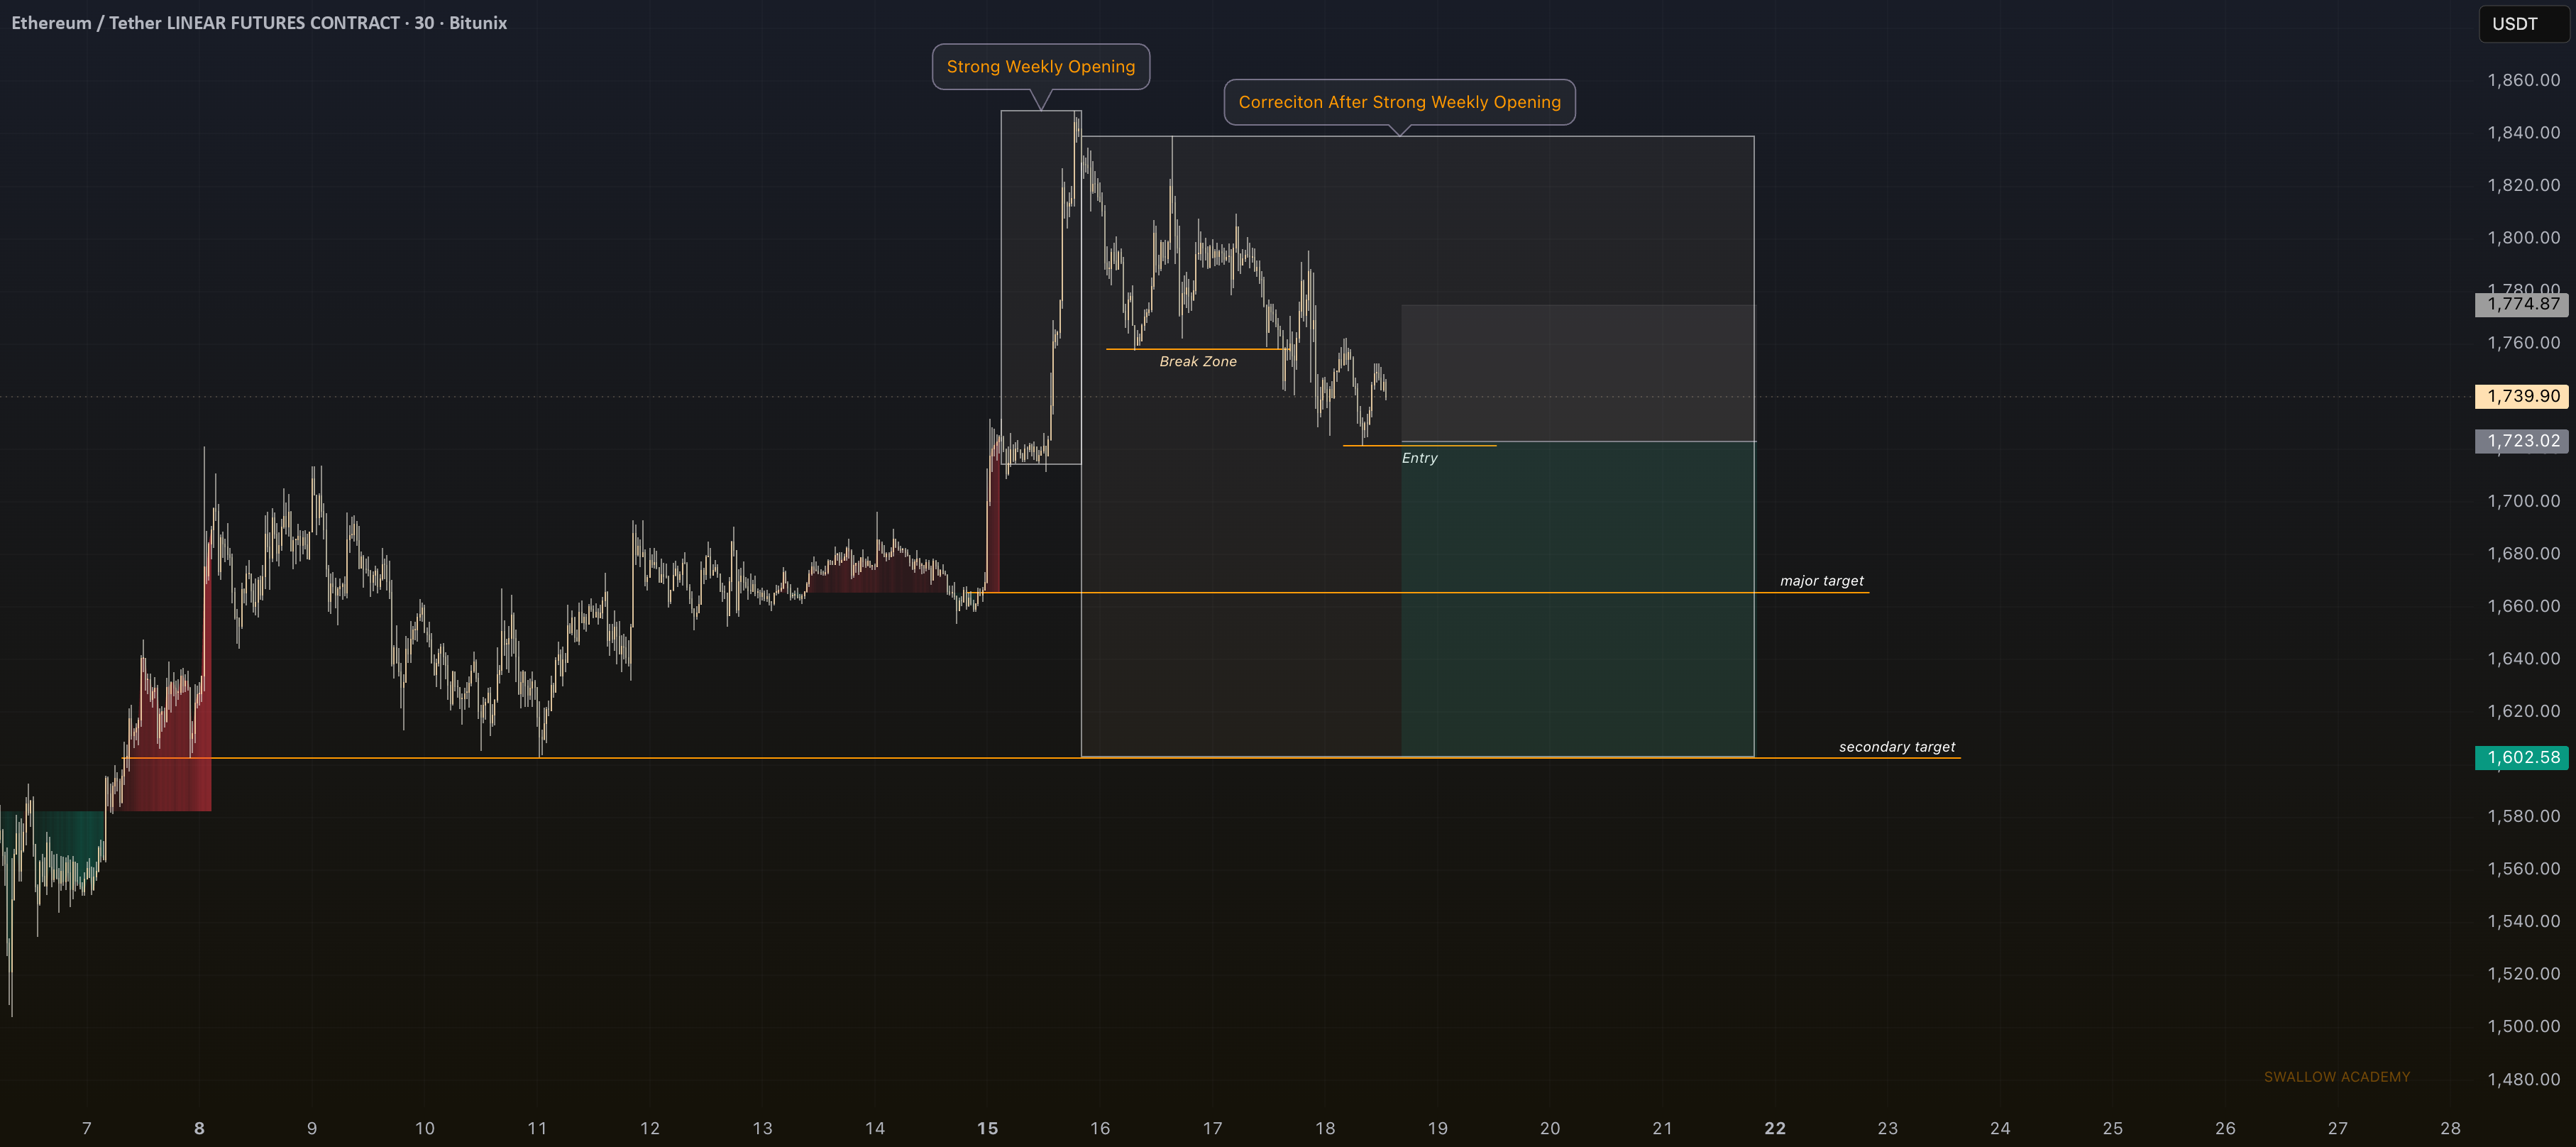
ETH/BTC Ratio Falls Back To Early-2023 Levels As Traders Debate Ethereum Value
An X analyst says ETH/BTC is back near 0.027, while a TradingView chart shows ET...
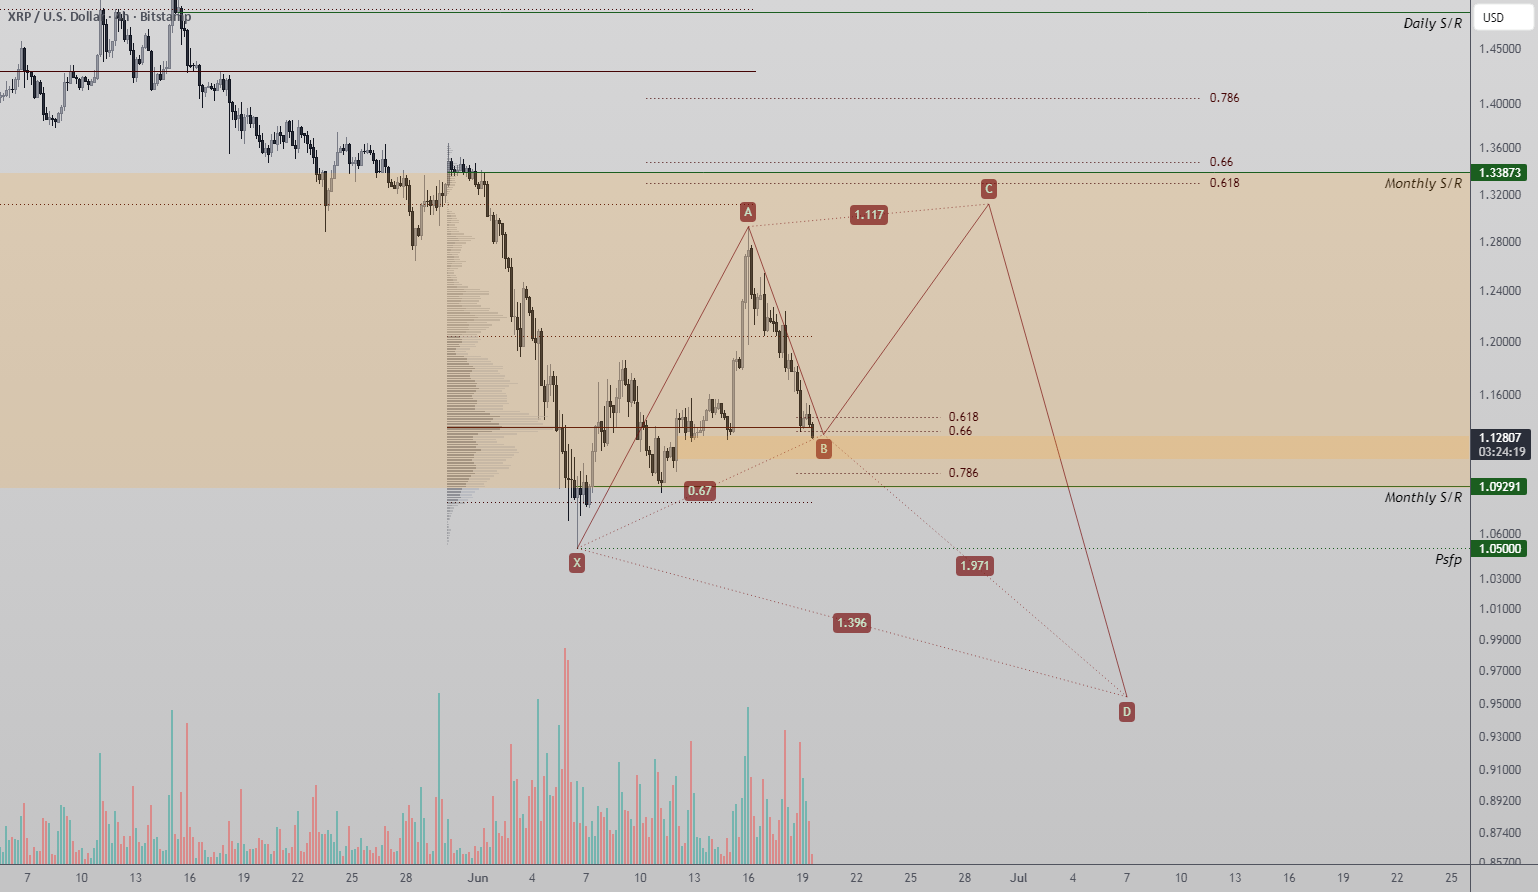
XRP Reversal Setup Forms Around Harmonic Pattern And Key Support Zone
A TradingView analyst says XRP is testing a technically important support zone s...