Tube Investments Forms Ascending Triangle Pattern Hinting At A Short-Term Bullish Breakout
Alex Smith
2 months ago

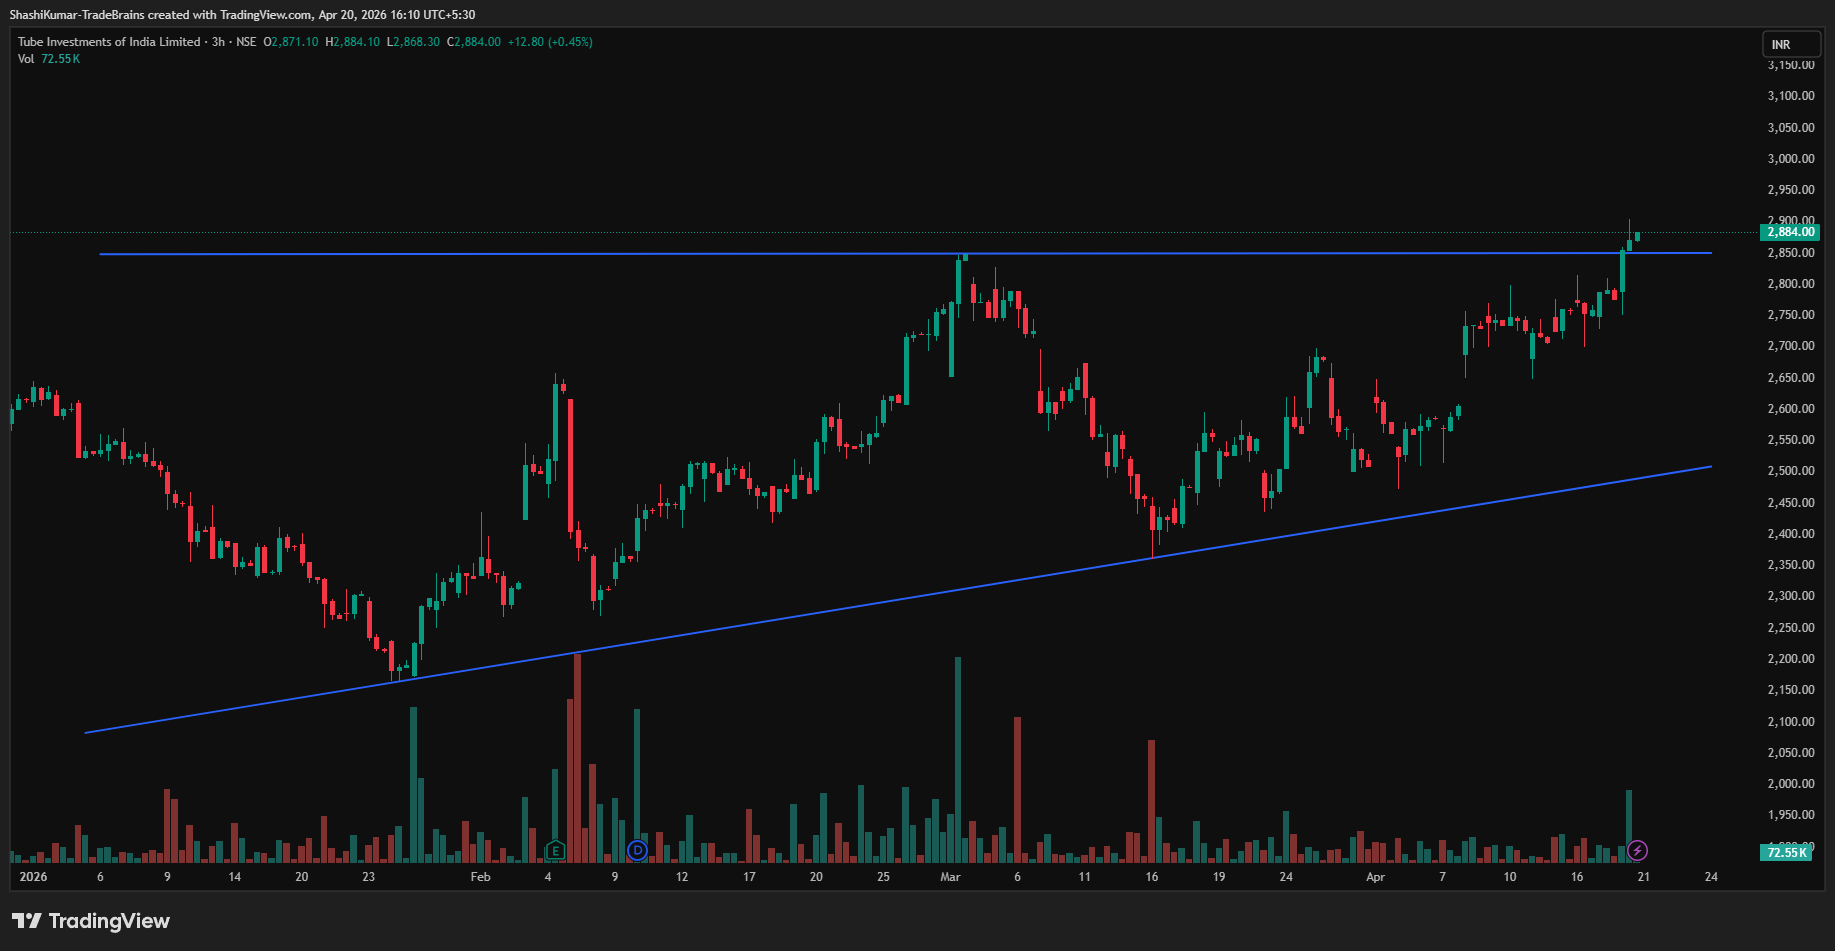
Synopsis: Tube Investments of India Ltd has formed an ascending triangle pattern on the 3-hour chart, indicating a possible short-term bullish breakout.
An ascending triangle is a bullish continuation pattern characterised by higher lows and a flat resistance level, suggesting increasing buying pressure. The stock has confirmed a breakout above its horizontal resistance, supported by a noticeable surge in trading volume. This signals strengthening demand and points toward a potential upward move in the near term.
On Monday, Tube Investments of India Ltd broke the resistance neckline and sustained above the Rs 2,850 level on the 3-hour chart, reinforcing its bullish momentum.
Typically, traders project targets in such patterns either by identifying the next resistance level or by measuring the height of the triangle and adding it to the breakout point, provided volume and momentum support the move.
Tube Investments of India Ltd Chart: 3-hour Timeframe
Indicator Confirmation
- RSI: The daily RSI indicates bullish momentum, as it rose from 63.07 in the previous trading session to 67.59 on Monday.
- MACD: On the daily time frame, the blue MACD line was above the orange signal line, with the histogram turning green, indicating bullish momentum.
- Moving Averages: On the daily time frame, the 5-day moving average was above the 9-day moving average, further confirming a bullish trend.
- Price Volume Trend: The Price Volume Indicator confirms the uptrend, accompanied by a sharp increase in buying volume in the daily time frame.
Implications
The ascending triangle pattern suggests continued upside potential. Sustaining it above the Rs 2,850 level, especially with strong volumes, would further strengthen the short-term bullish case.
About the stock
Tube Investments of India Limited is a flagship company of the Murugappa Group, headquartered in Chennai. It operates across mobility, engineering, and metal-formed products, with over 35 manufacturing facilities in India. The company is a market leader in cold-drawn welded (CDW) steel tubes and transmission chains and is also the second-largest manufacturer of cycle transmission chains in India.
Over the past month, the stock has gained 13.66%. However, it remains down 7.75% over the last six months, while delivering an 11.21% return on a year-over-year basis. For more such technical stock ideas, click here to view our research page.
Disclaimer: The views and investment tips expressed by investment experts/broking houses/rating agencies on tradebrains.in are their own, and not that of the website or its management. Investing in equities poses a risk of financial losses. Investors must therefore exercise due caution while investing or trading in stocks. Trade Brains Technologies Private Limited or the author are not liable for any losses caused as a result of the decision based on this article. Please consult your investment advisor before investing.
The post Tube Investments Forms Ascending Triangle Pattern Hinting At A Short-Term Bullish Breakout appeared first on Trade Brains.
Related Articles

Persistent Systems Shares: Can Europe Expansion and AI Deliver Long-Term Growth?
Synopsis: Persistent Systems remains focused on expanding its business through s...

Oriana Power: After Missing FY26 Expectations, Can ₹7,000 Cr Order Book Change the Narrative?
Synopsis: Oriana Power missed its FY26 expectations due to commodity inflat...

3 Indian Companies Capturing the Global Medical Consumables Opportunity
Synopsis:- Global hospitals and laboratories are leaning more heavily on Indian...

Power Infra Stock Targets Over 40% Growth as BESS and Green Hydrogen Investments Gather Pace
Synopsis: An energy transition-focused company is entering FY27 with strong grow...