Trent Ltd Forms An Ascending Triangle Pattern Signalling A Bullish Reversal
Alex Smith
4 hours ago

Synopsis: Trent Ltd has formed an ascending triangle on the 1-week chart.
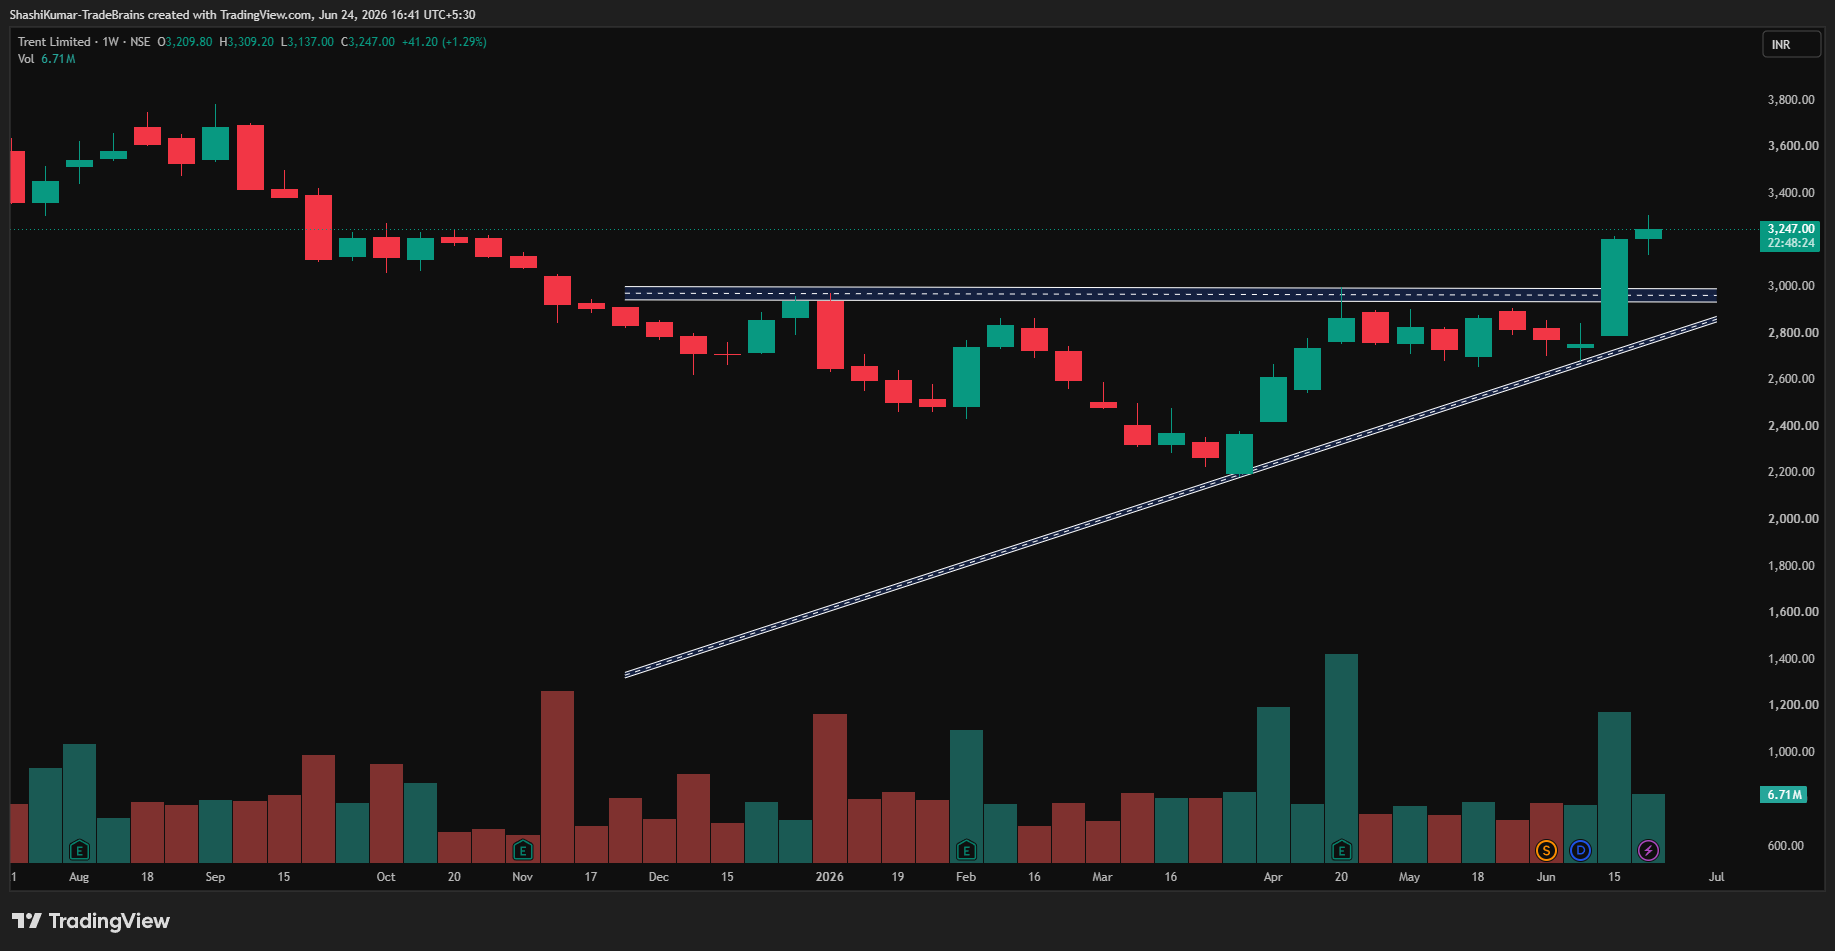
A flat resistance line and higher lows characterise an ascending triangle, a bullish reversal pattern. The chart shows a bullish breakout above the key resistance zone near Rs 3,000, supported by strong buying momentum.
On 17th June, Trent Ltd broke above the key resistance level of Rs 3,000 and held there, transforming it into a strong support zone. On the weekly chart, the stock closed at Rs 3,247 on 24th June, indicating that bullish momentum has continued and buying interest has strengthened.
In an ascending triangle pattern, traders typically target the next resistance level or project a price move equal to the triangle’s height from the breakout point, while strong buying volume and positive momentum help confirm the bullish breakout.
Trent Ltd Chart: 1-week Timeframe
Indicator Confirmation
- RSI: The weekly RSI indicates slight buying pressure, as it rose from 62.62 in the previous week’s trading session to 63.55 on Wednesday.
- Price Volume Trend: The Price Volume Indicator confirms the uptrend, accompanied by an increase in buying volume in the weekly time frame.
- MACD: On the weekly time frame, the blue MACD line was above the orange signal line, with the histogram turning green, indicating bullish momentum.
- Moving Averages: On the weekly time frame, the 5-day EMA was above the 9-day EMA, further confirming a bullish trend.
Implications
The ascending triangle breakout in a downtrend points toward a bullish reversal pattern. So long as the stock sustains above the newly established Rs 3,000 support level on strong volume, the near-term bullish outlook remains firmly intact.
About the stock
Tata Group’s Trent Limited operates three core retail formats: Westside, a premium fashion chain between 20,000 and 30,000 sq. ft offering apparel, cosmetics, and home decor; Zudio, a value-fashion destination around 7,000-12,000 sq. ft providing affordable clothing and beauty products; and Star, a supermarket concept offering fresh produce, daily essentials, and exclusive own-branded FMCG goods built on a high-repeat customer model.
Trent Ltd continues its strong upward trajectory, posting a 13.58% gain this month and a 13.86% surge over the last six months. However, despite this recent momentum, the stock remains down 19.37% year-over-year. For more such technical stock ideas, clickhereto view our research page.
Disclaimer: The views and investment tips expressed by investment experts/broking houses/rating agencies on tradebrains.in are their own, and not that of the website or its management. Investing in equities poses a risk of financial losses. Investors must therefore exercise due caution while investing or trading in stocks. Trade Brains Technologies Private Limited or the author are not liable for any losses caused as a result of the decision based on this article. Please consult your investment advisor before investing.
The post Trent Ltd Forms An Ascending Triangle Pattern Signalling A Bullish Reversal appeared first on Trade Brains.
Related Articles
Data Centre Stock Hits 5% Upper Circuit After Receiving Approval to Raise Funds via QIP
Synopsis: Sterlite Technologies has initiated a fundraising exercise through ins...
Mayank Cattle Food Surges 4% as Trading Window Closes for Bonus Equity Review
Synopsis: Mayank Cattle Food Limited’s shares surged after announcing a board me...

SRF Shares: 5 Reasons Why Motilal Oswal Is Bullish on This Chemical Stock
Synopsis: SRF Limited is in focus after Motilal Oswal assigned a Buy rating wit...

5 Textile Stocks in Which Motilal Oswal Sees a Bullish Move With Up to 30% Upside
Synopsis: Motilal Oswal is bullish on five textile stocks, Gokaldas Exports, Ind...