This Key Metric Shows Bitcoin Is Approaching A Crucial Confluence Zone
Alex Smith
1 month ago

After a bullish weekend, Bitcoin appears to be gaining more upside momentum with its price back above the $77,000 level as buying pressure increases across the market. Meanwhile, underneath the price performance, a critical junction may be forming for the flagship cryptocurrency asset, which could determine the next potential price direction.
How The Bitcoin Price Dynamics Are Playing Out
While Bitcoin’s price is displaying renewed upward strength, a key on-chain metric is hinting at the asset nearing an important confluence zone. This region, where several indicators and technical levels coincide, frequently serves as a pivotal battlefield for buyers and sellers.
These zones have historically seen significant price movements as market factors come together and volatility starts to increase. According to Darkfost, a verified author at the CryptoQuant platform, this trend can be observed through the Bitcoin Supply Distribution Heatmap.
The metric combines three interesting elements, such as the Distribution Clusters, which measure buying and selling activity, the True Market Mean Price, and the Short-Term Holder Cost Basis. At the moment, Bitcoin is trading within a white zone as seen on the chart, where relatively little exchange activity has taken place.
Currently, this confluence zone has extended up to $83,000, a level that many investors reacted to in the past and which could also act as resistance. At the same time, both the Short-Term Holders Cost Basis and the True Mean Price are trending around $79,000. This level continues to act as resistance as well, capping off upward attempts.
In the expert’s view, the adjusted short-term holders’ cost basis is closer to the $83,000 mark after taking into consideration the Bitcoin that Coinbase shifted. Darkfost believes that for a potential continued upward move, BTC must test these levels soon. Its reaction here is one that the expert considers a crucial signal to monitor.
BTC’s Price Trending In A Rising Channel
A key Rising Channel pattern has emerged on the Bitcoin 4-hour time frame chart as the asset continues its uptrend. Following his examination of the price on the chart, Ali Charts, a seasoned market expert and trader, highlighted that BTC is now consolidating within this rising channel.
As seen on the chart, the asset faced rejection at the upper boundary of the pattern, which forced its price to return to test the lower support zone at roughly $77,000. While BTC has broken past $77,000, this level remains the primary structural barrier for the current trend. At this point, buyers must defend this level in order for the rising channel to remain valid.
Should this floor hold, Ali Charts claims that it could serve as a strategic rebound zone to send BTC back toward the mid-range near the channel at $81,500. A secondary target is still highlighted at the top of the channel at roughly $84,500. In the meantime, a decisive close below $77,000 would signal a breakdown of this short-term structure and invalidate the optimistic outlook.
Related Articles
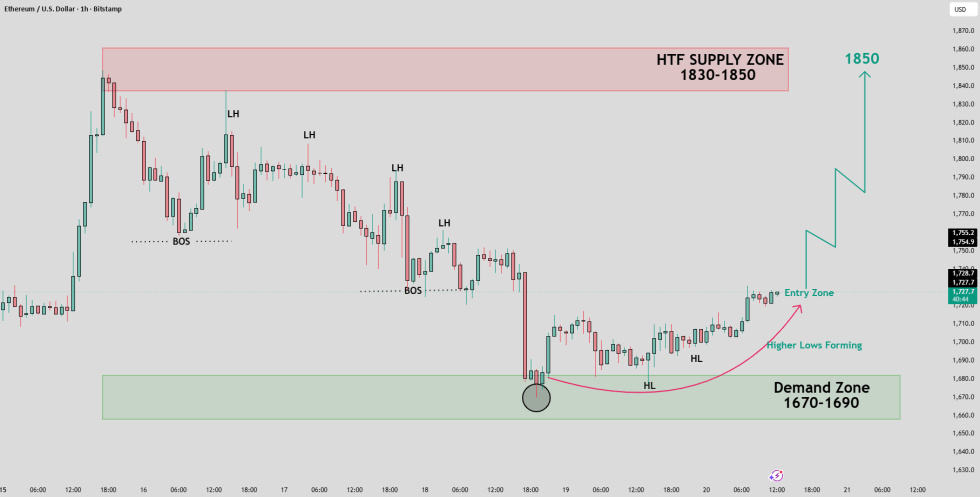
Ethereum Price Setup Targets $1,850 As Buyers Defend Key Demand Zone
A TradingView analyst says Ethereum could target $1,850 if buyers defend the $1,...
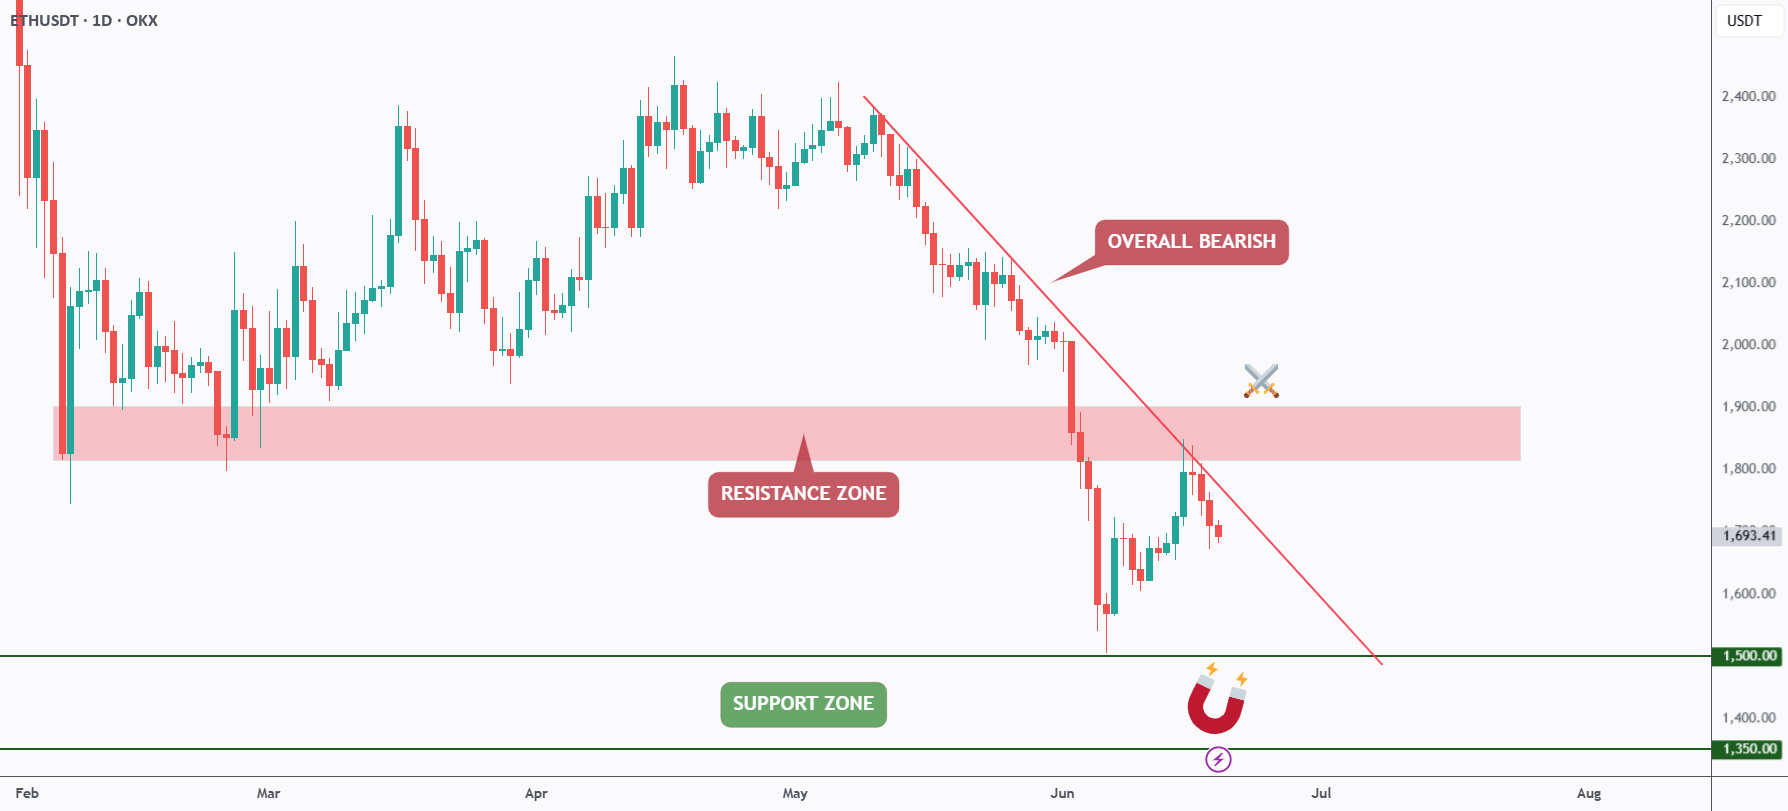
Ethereum Bears Keep Control As ETH Rejects Trendline Resistance
A TradingView analyst says Ethereum remains bearish below a falling trendline, w...
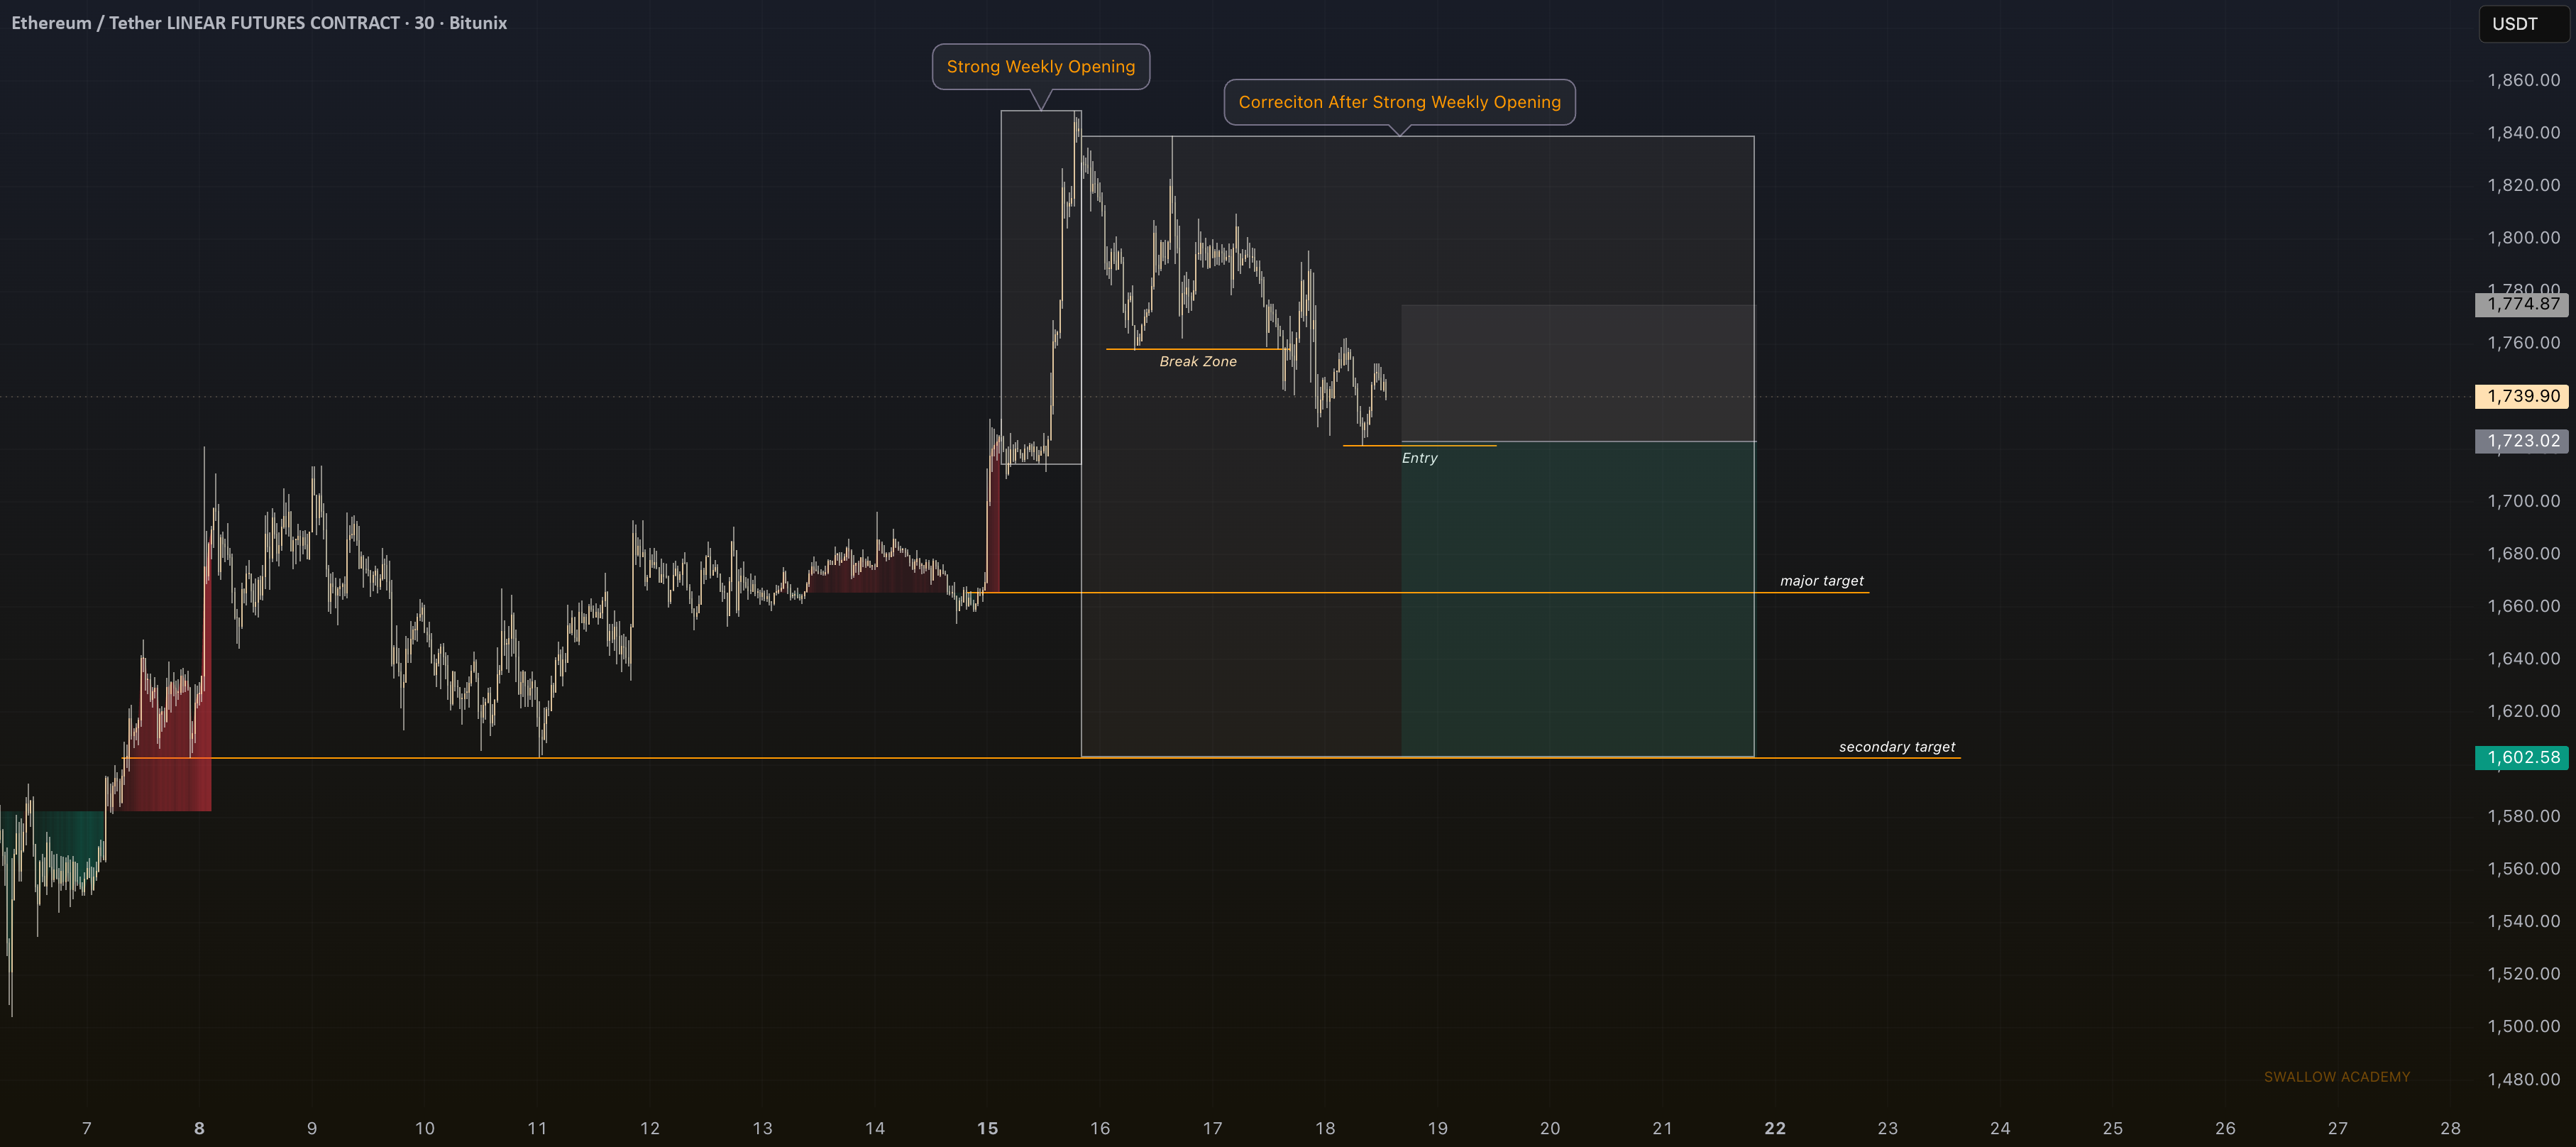
ETH/BTC Ratio Falls Back To Early-2023 Levels As Traders Debate Ethereum Value
An X analyst says ETH/BTC is back near 0.027, while a TradingView chart shows ET...
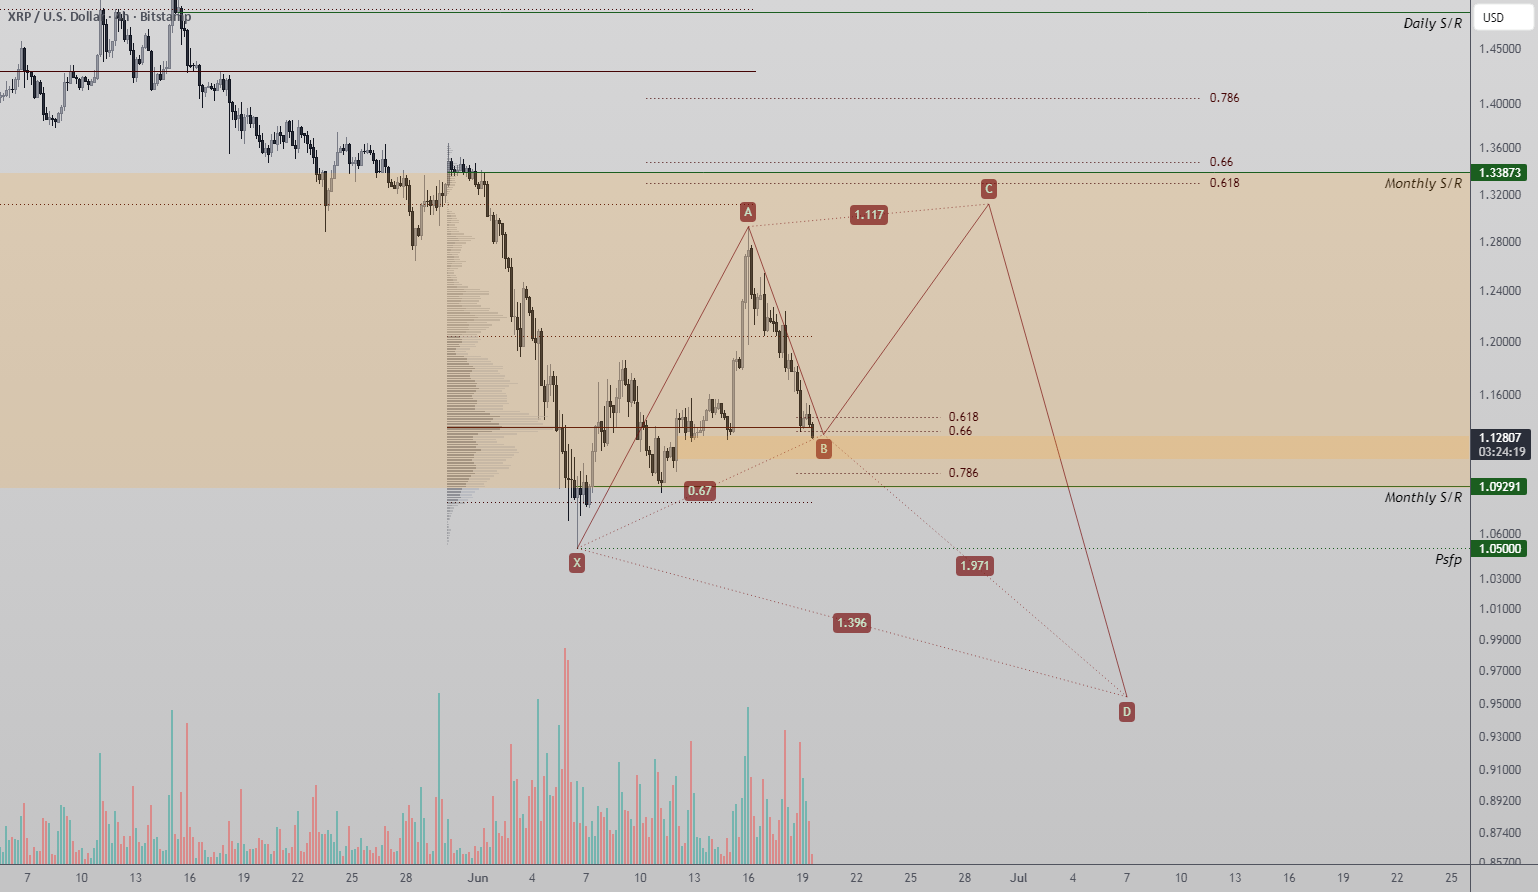
XRP Reversal Setup Forms Around Harmonic Pattern And Key Support Zone
A TradingView analyst says XRP is testing a technically important support zone s...