Solana (SOL) Breakdown Accelerates At $90, $80 Suddenly Looks Vulnerable
Alex Smith
4 months ago
Solana failed to settle above $102 and extended losses. SOL price is now consolidating losses below $95 and might struggle to start a recovery wave.
- SOL price started a fresh decline below $100 and $95 against the US Dollar.
- The price is now trading below $100 and the 100-hourly simple moving average.
- There is a key bearish trend line forming with resistance at $98 on the hourly chart of the SOL/USD pair (data source from Kraken).
- The price could start a recovery wave if the bulls defend $90 or $85.
Solana Price Dips Further
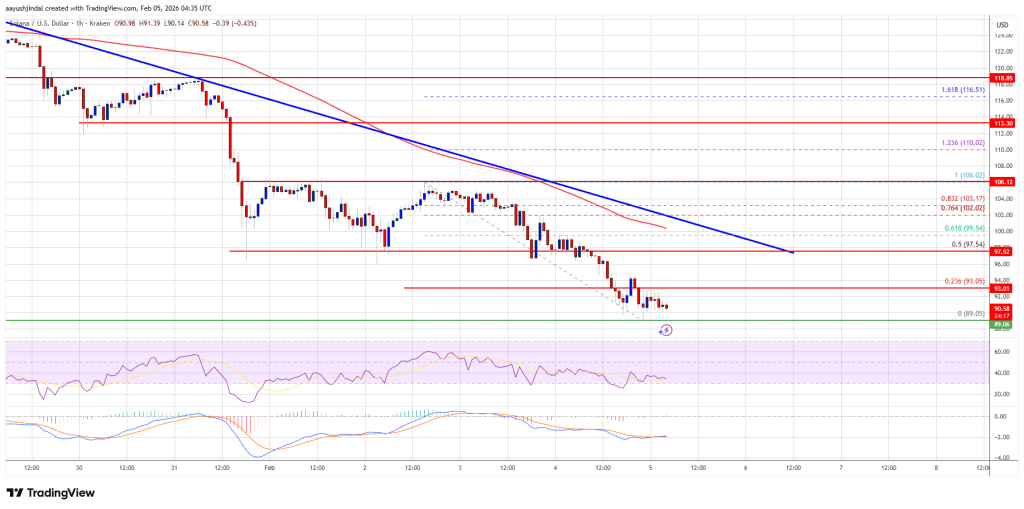
Solana price failed to remain stable above $105 and started a fresh decline, like Bitcoin and Ethereum. SOL declined below the $100 and $95 support levels.
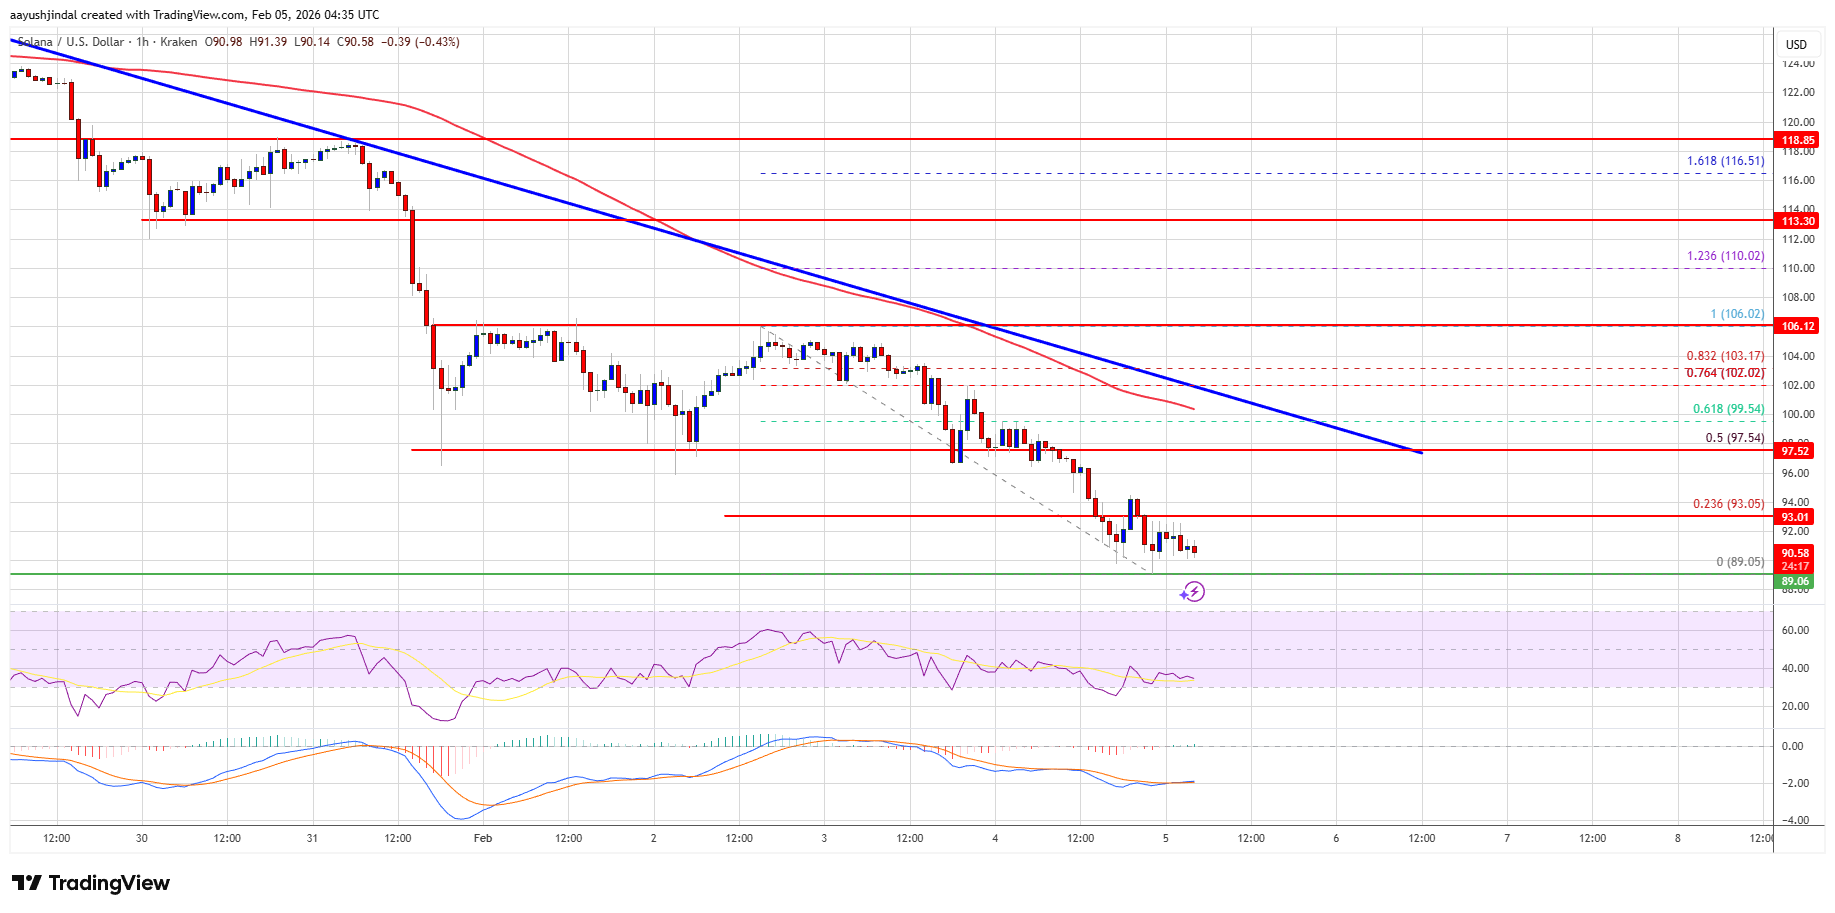
The price gained bearish momentum below $92. A low was formed at $89, and the price is now consolidating losses with a bearish angle below the 23.6% Fib retracement level of the downward move from the $106 swing high to the $89 low.
Solana is now trading below $95 and the 100-hourly simple moving average. On the upside, immediate resistance is near the $93 level. The next major resistance is near the $97 level or the 50% Fib retracement level of the downward move from the $106 swing high to the $89 low. There is also a key bearish trend line forming with resistance at $98 on the hourly chart of the SOL/USD pair.
The main resistance could be $102. A successful close above the $102 resistance zone could set the pace for another steady increase. The next key resistance is $106. Any more gains might send the price toward the $112 level.
More Losses In SOL?
If SOL fails to rise above the $98 resistance, it could continue to move down. Initial support on the downside is near the $90 zone. The first major support is near the $85 level.
A break below the $85 level might send the price toward the $82 support zone. If there is a close below the $82 support, the price could decline toward the $74 support in the near term.
Technical Indicators
Hourly MACD – The MACD for SOL/USD is gaining pace in the bearish zone.
Hourly Hours RSI (Relative Strength Index) – The RSI for SOL/USD is below the 50 level.
Major Support Levels – $90 and $85.
Major Resistance Levels – $98 and $102.
Related Articles

Bitcoin Bears Eye Lower Levels As TradingView Analysts Flag Failed Recovery
TradingView analysts warn Bitcoin's rebound may still be a resistance retest as...

Bitcoin Reclaims $63,500 As Traders Watch For Squeeze Toward $67,000
Bitcoin bulls are watching the $63,500 support zone as traders map a potential s...

Bitcoin Analysts Split Between Buyer Demand And Resistance Ceiling Near $65,000
Bitcoin analysts are split as BTC shows buyer demand but still faces a resistanc...

Bitcoin Faces Key $64,100 Resistance As Analyst Watches Fib Reaction Zone
An X analyst says Bitcoin is approaching local H4 resistance near $64,100, a lev...