Pidilite Forms A Double-Bottom Pattern Hinting At A Near-Term Bullish Reversal; Check The Details
Alex Smith
4 months ago

Synopsis: Pidilite Industries Ltd has formed a double-bottom pattern on the 1-hour chart, indicating a potential near-term bullish reversal.
The emergence of a double-bottom pattern after a prolonged decline highlights strong buying support at lower levels. A breakout above the neckline signals the potential for a bullish trend reversal.
The double-bottom pattern suggests a potential trend reversal after a prior decline, marked by two similar lows around a key support area. A clear breakout above the neckline indicates strengthening buying interest, signalling waning seller control and the potential for upside momentum to build.
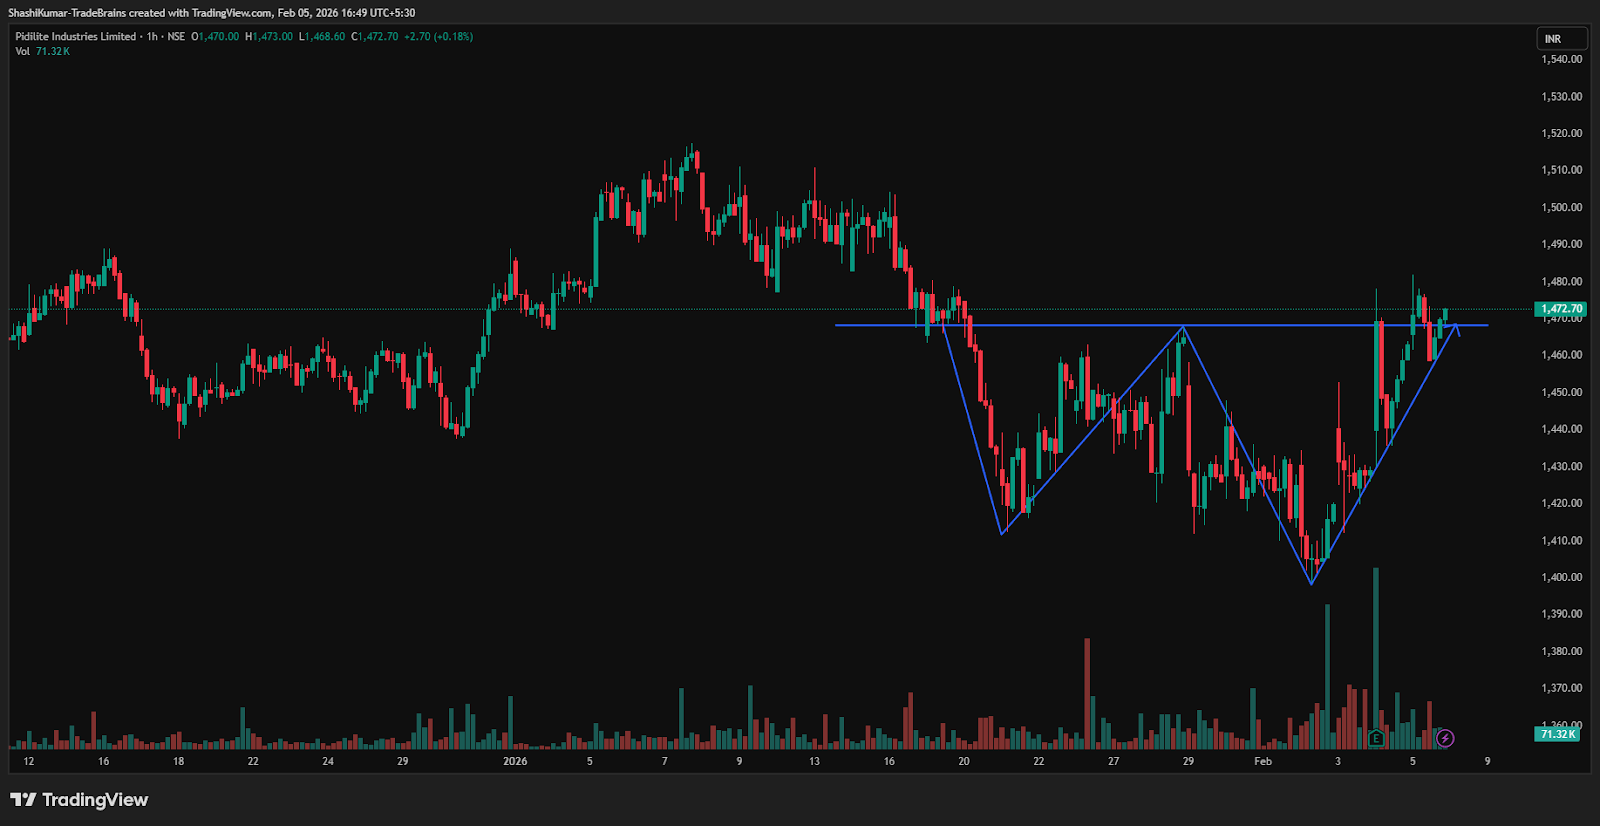
On Thursday, Pidilite Industries Ltd formed a double-bottom pattern on the 1-hour chart and decisively broke above the neckline, backed by improving buying interest. Sustained trading above this level could reinforce upside potential and further confirm the near-term trend reversal.
In a double-bottom formation, upside targets are typically derived from the immediate resistance levels above the neckline. These zones are often used by traders for partial or full profit booking, while closely monitoring price action for continuation or early signs of exhaustion.
Pidilite Industries Ltd Chart: 1-hour Timeframe
Indicator Confirmation
- RSI: The daily RSI indicates bullish momentum, as it rose from 50 in the previous trading session to 53.80 on Thursday, confirming the continuation of the reversal.
- MACD: On 1-hour time frame, the Blue MACD line crossed above the orange signal line, with the histogram turning green, indicating bullish momentum.
- Moving Averages: On the 1-hour time frame, the 5-day moving average has crossed above the 9-day moving average, further confirming a bullish trend.
- Price Volume Trend: The Price Volume Indicator confirms the uptrend, supported by a sharp increase in buying volume.
Implications
The formation of a double-bottom pattern signals potential upside. A sustained close above the crucial Rs 1,468 level, ideally supported by stronger buying volumes, would validate the reversal and reduce the likelihood of a false breakout. With the earlier resistance near Rs 1,468 now turning into immediate support, holding above this zone would strengthen near-term bullish momentum.
About the stock
Pidilite Industries Ltd is a leading Indian manufacturer of adhesives, sealants, construction chemicals, DIY products and polymer emulsions. Its portfolio spans paint, automotive and industrial chemicals, art materials and fabric care, supported by strong in-house R&D. The company owns iconic brands such as Fevicol, M-Seal, Fevikwik, Dr. Fixit, Araldite and Fevicryl.
Over the past month, Pidilite Industries Ltd has slipped 2.15%, indicating ongoing weakness. Over a six-month period, the stock has edged down 1.74%, though it continues to show a modest year-on-year gain of 1.95%. For more such technical stock ideas, click here to view our research page.
Disclaimer: The views and investment tips expressed by investment experts/broking houses/rating agencies on tradebrains.in are their own, and not that of the website or its management. Investing in equities poses a risk of financial losses. Investors must therefore exercise due caution while investing or trading in stocks. Trade Brains Technologies Private Limited or the author are not liable for any losses caused as a result of the decision based on this article. Please consult your investment advisor before investing.
The post Pidilite Forms A Double-Bottom Pattern Hinting At A Near-Term Bullish Reversal; Check The Details appeared first on Trade Brains.
Related Articles

5 Stocks Recommended by Top Brokerages That Can Deliver Returns of Up to 45%
Synopsis: Five top brokerages have issued fresh Buy calls across IT, FMCG, trave...

₹3,200 Cr Order Book: Can This Smart Meter Stock Evolve Into an Electrical Solutions Co.?
Synopsis: HPL Electric delivered a record FY26, backed by strong smart meter dem...

Tata Motors: Can It Double Passenger Vehicle Volumes and Reach 20% Market Share by FY31?
Synopsis: Tata Motors targets strong PV growth with EV-led expansion, aiming to...

KPIT Technologies: Will Q1 Results Be Strong Enough For A Turnaround?
Synopsis: KPIT Technologies has spent the past year explaining why growth slowed...