JB Chemicals Stock Forms an Ascending Triangle Pattern Signalling a Short-term Bullish Breakout
Alex Smith
3 weeks ago

Synopsis: JB Chemicals and Pharmaceutical Ltd has formed an ascending triangle on the 4-hour chart, signalling a possible short-term bullish breakout.
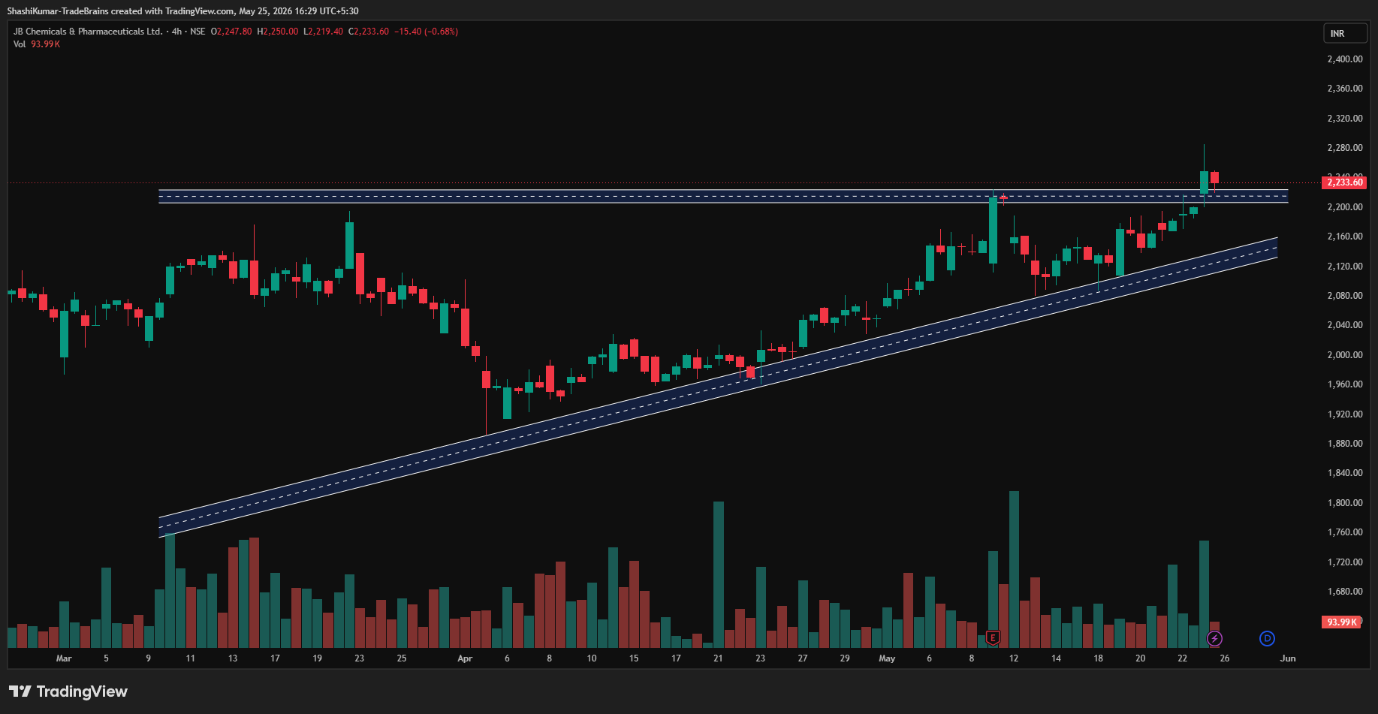
An ascending triangle is a bullish continuation pattern marked by higher lows and a flat resistance line. The chart shows a confirmed bullish breakout above the resistance neckline. Supported by a volume surge and points to a potential short-term upward move.
JB Chemicals & Pharmaceuticals Ltd moved above the key resistance level of Rs 2,225 on Monday, turning it into a strong support zone. The stock closed at Rs 2,228.40 above the support levels, indicating sustained bullish momentum and continued buying interest.
In an ascending triangle, traders typically target the nearest resistance level or project a price move equal to the triangle’s height from the breakout point, using strong volume and momentum to confirm the trade.
JB Chemicals and PharmaceuticalLtd Chart: 4-hour Timeframe
Indicator Confirmation
- RSI: The daily RSI indicates buying pressure, as it rose from 63.58 in the previous trading session to 67.29 on Monday.
- Price Volume Trend: The Price Volume Indicator confirms the uptrend, accompanied by an increase in buying volume in the daily time frame.
- MACD: On the daily time frame, the blue MACD line was above the orange signal line, with the histogram turning green, indicating bullish momentum.
- Moving Averages: On the daily time frame, the 5-day EMA was above the 9-day EMA, further confirming a bullish trend.
Implications
The ascending triangle pattern indicates continued upside potential. Sustaining above the Rs 2,225 support level, supported by strong trading volumes, could further strengthen the near-term bullish outlook.
About the stock
JB Chemicals & Pharmaceuticals Ltd is a leading Indian pharmaceutical company headquartered in Mumbai, known for its strong presence in medicines, healthcare products, and contract manufacturing services. The company operates across India and more than 40 countries, with a strong focus on gastroenterology, hypertension, dermatology, and other specialty therapies. JB Pharma is recognized for its quality manufacturing, strong product portfolio, and consistent growth in both domestic and international markets.
JB Chemicals and Pharmaceutical Limited has shown strong upward momentum, gaining 8.72% over the past month. The stock has also risen 25.68% in the last six months and delivered a 30.79% gain on a year-over-year basis. For more such technical stock ideas, clickhereto view our research page.
Disclaimer: The views and investment tips expressed by investment experts/broking houses/rating agencies on tradebrains.in are their own, and not that of the website or its management. Investing in equities poses a risk of financial losses. Investors must therefore exercise due caution while investing or trading in stocks. Trade Brains Technologies Private Limited or the author are not liable for any losses caused as a result of the decision based on this article. Please consult your investment advisor before investing.
The post JB Chemicals Stock Forms an Ascending Triangle Pattern Signalling a Short-term Bullish Breakout appeared first on Trade Brains.
Related Articles

Steel Stock With $1.1 Billion Capex and 129% Revenue Growth Target to Look Out For
Synopsis: Shyam Metalics outlined its FY31 growth roadmap focused on expanding...

Are Ambuja, UltraTech, Dalmia, and Nuvoco Best Placed to Benefit From Improving Sector Fundamentals?
Synopsis: HSBC remains positive on the cement sector as cost pressures are expec...

Battery Recycling Stock Targets 500% Revenue Growth as Critical Mineral Recovery Drives Its Next
Synopsis: Namo e-Waste is expanding recycling and critical mineral recovery capa...
Dr Reddy’s Stock Receives ‘Buy’ Call From Nomura; Check the Upside
Synopsis: The brokerage firm assigns the pharma stock a ‘Buy’ recom...