Havells India Forms Bullish Engulfing Pattern; Check Support and Resistance Levels
Alex Smith
2 weeks ago

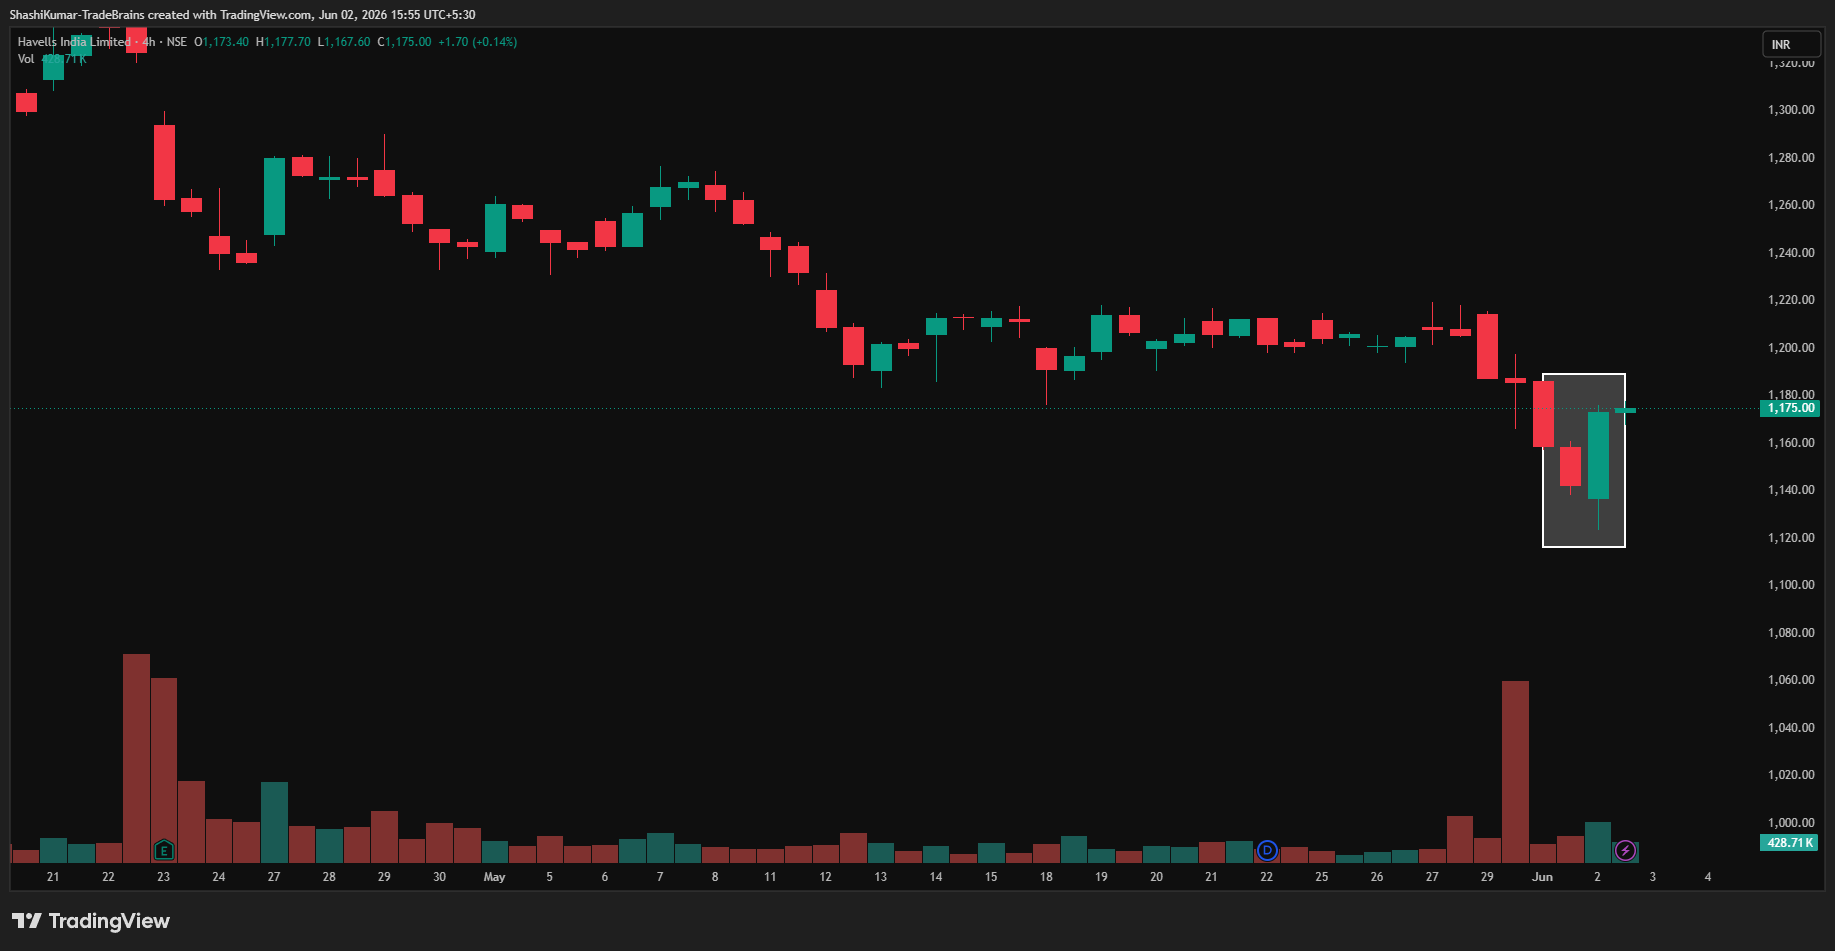
Synopsis: Havells India Ltd formed a bullish engulfing pattern on the 4-hour chart, signalling a possible near-term bullish reversal.
This pattern indicates a momentum reversal, as buyers overpower sellers after a brief period of weakness. The bullish candle engulfing the prior bearish one shows a distinct shift in sentiment as buyers regain control.
On Tuesday, Havells India Ltd formed this bullish engulfing pattern following a brief corrective phase. The strong green candle was supported by high buying volumes. A sustained move above 1,176 could trigger further upside, while a drop below 1,173 would weaken the bullish outlook.
In a bullish engulfing pattern, targets are typically set near the closest resistance levels following the reversal. Traders may trail profits as prices rise, booking partial or full gains around key resistance levels while monitoring follow-through strength and volume for signs of early exhaustion.
Havells India Ltd Chart: 4-hour Timeframe
Indicator Confirmation
RSI: The daily RSI indicates buying pressure, as it rose from 31.23 in the previous trading session to 40.28 on Tuesday.
Price Volume Trend: The Price Volume Indicator confirms the uptrend, accompanied by an increase in buying volume in the daily time frame.
Implications
The formation of a bullish engulfing pattern points to potential upside for Havells India Ltd. A sustained move above the key 1,176 level, preferably on strong buying volumes, would confirm the reversal and reduce the risk of a false signal. Holding above this level would reinforce near-term bullish momentum.
About the stock
Havells India Ltd is a leading FMEG (fast-moving electrical goods) and a consumer durable company, with a presence across 70 countries. They offer switchgears, cables, lighting and fixtures, and electrical consumer durables. Currently, the company has 17 manufacturing units, 4 research centres, and a 20,700-dealer network as of FY26.
Over the past month, the Havells India Ltd share price has fallen 6.49%, indicating sustained weakness. Over the last six months, the stock has declined 17.40% and remains down 22.43% compared to the same period last year. For more such technical stock ideas, click here to view our research page.
The post Havells India Forms Bullish Engulfing Pattern; Check Support and Resistance Levels appeared first on Trade Brains.
Related Articles

5 Stocks That Could Quietly Dominate India’s Clean Energy Supply Chain
Synopsis: India’s ambitious 2030 goal of achieving 5 MMT of green hydrogen produ...

3 Defence Stocks That Could Benefit From India’s ₹50,000 Cr Defense Export Boom
Synopsis: While big-ticket defense platforms like fighter jets, advanced warship...

Lloyds Group Acquires 88.12% Stake in SISCOL for ₹1,073 Cr
Synopsis: In one of the largest mid-cap infrastructure deals this year, Lloyds E...

Silgo Retail Locks in 25 Years of Guaranteed Income with 37 MW Solar Deal
Synopsis : Silgo Retail Limited has made a major announcement regarding its fora...