Ethereum Price Slides Deeper, $1,800 Emerges as Crucial Battleground
Alex Smith
1 month ago

Ethereum price started a fresh decline below $1,880. ETH is now consolidating losses and might struggle to recover above $1,880 or $1,900.
- Ethereum failed to stay above $1,920 and started a fresh decline.
- The price is trading below $1,900 and the 100-hourly Simple Moving Average.
- There is a bearish trend line forming with resistance at $1,920 on the hourly chart of ETH/USD (data feed via Kraken).
- The pair could start a fresh decline if it stays below the $1,900 zone.
Ethereum Price Dips Further
Ethereum price failed to stay above $1,900 and started a fresh decline, like Bitcoin. ETH price traded below the $1,880 and $1,860 levels to enter a bearish zone.
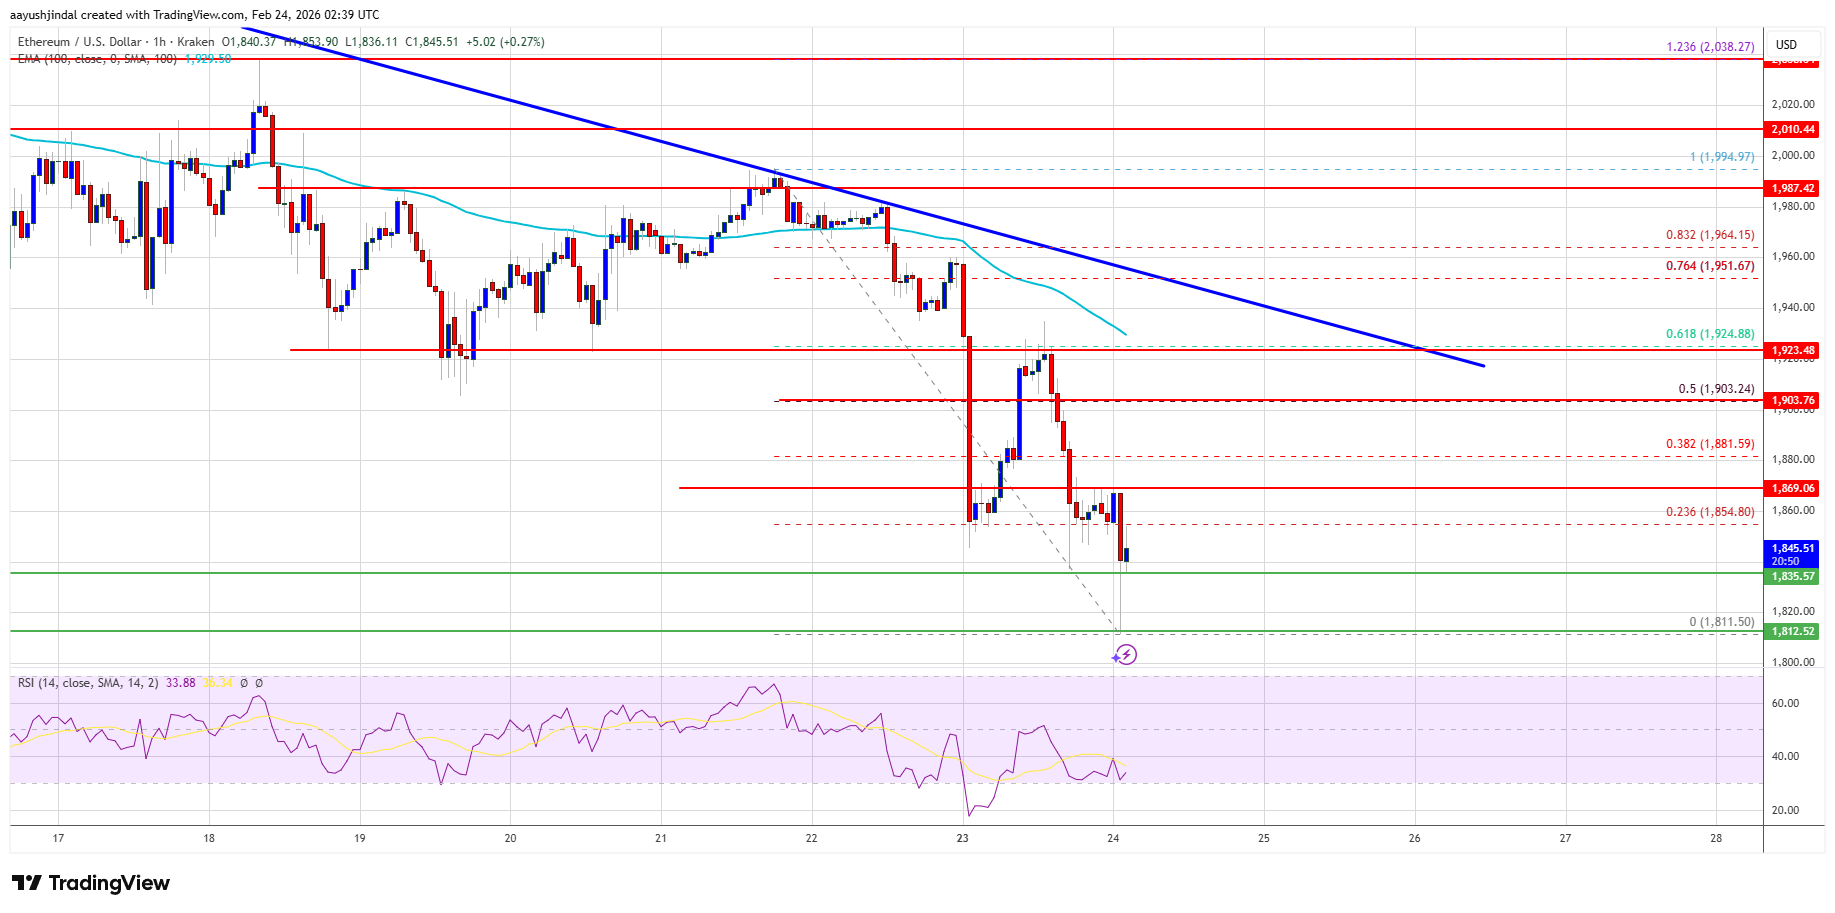
Finally, the bulls appeared near $1,810. A low was formed at $1,811, and the price started a minor recovery wave. There was a move above the $1,840 level, but the price is still below the 23.6% Fib retracement level of the downward move from the $1,995 swing high to the $1,811 low.
Ethereum price is now trading below $1,880 and the 100-hourly Simple Moving Average. If the bulls remain in action above $1,820, the price could attempt another increase. Immediate resistance is seen near the $1,870 level.
The first key resistance is near the $1,900 level and the 50% Fib retracement level of the downward move from the $1,995 swing high to the $1,811 low. The next major resistance is near the $1,920 level. There is also a bearish trend line forming with resistance at $1,920 on the hourly chart of ETH/USD.
A clear move above the $1,920 resistance might send the price toward the $1,965 resistance. An upside break above the $1,965 region might call for more gains in the coming days. In the stated case, Ether could rise toward the $2,000 resistance zone or even $2,020 in the near term.
Another Drop In ETH?
If Ethereum fails to clear the $1,900 resistance, it could start a fresh decline. Initial support on the downside is near the $1,835 level. The first major support sits near the $1,820 zone.
A clear move below the $1,820 support might push the price toward the $1,780 support. Any more losses might send the price toward the $1,740 region. The main support could be $1,720.
Technical Indicators
Hourly MACD – The MACD for ETH/USD is gaining momentum in the bearish zone.
Hourly RSI – The RSI for ETH/USD is now below the 50 zone.
Major Support Level – $1,820
Major Resistance Level – $1,900
Related Articles

Pundit Says This Chart Paints The Clearest Macro Picture For XRP
Crypto analyst Mattsby has highlighted the best chart for market participants se...
Bitcoin, Ethereum Trading Expands As Charles Schwab Enters Crypto Market
Charles Schwab is charging into the crypto space with fees lower than its closes...

Bitcoin Breaks Above $75K, But Bears Refuse To Blink
Bitcoin has reclaimed and held above the $75,000 region after the latest rebound...
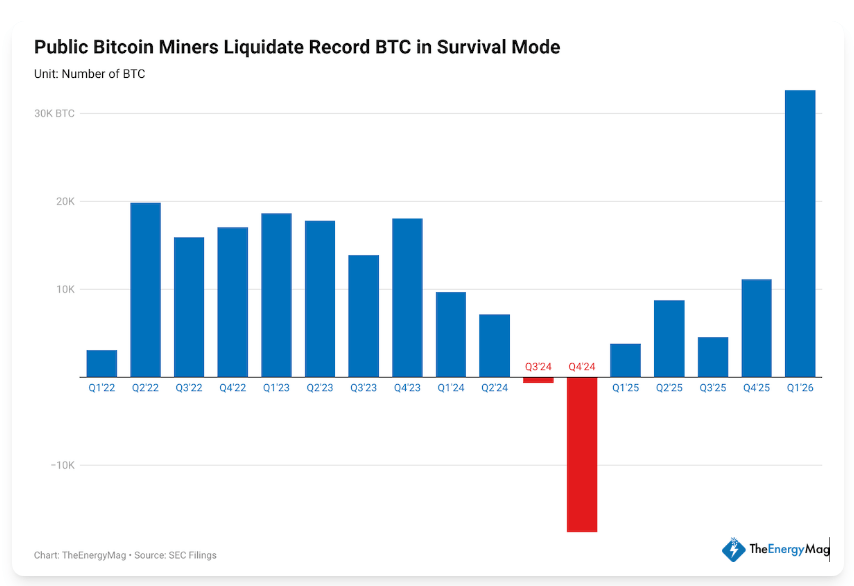
Bitcoin Pressure Builds As Miners Dump 32K BTC In Just 3 Months
About 20% of the Bitcoin mining industry is operating at a loss right now. That...