Ethereum Price Crashes 6%, Downtrend Signals Strengthen Sharply
Alex Smith
1 month ago
Ethereum price started a fresh decline below $1,900. ETH is now consolidating losses and might struggle to recover above $1,920 or $1,950.
- Ethereum failed to stay above $1,950 and started a fresh decline.
- The price is trading below $1,920 and the 100-hourly Simple Moving Average.
- There is a bearish trend line forming with resistance at $1,950 on the hourly chart of ETH/USD (data feed via Kraken).
- The pair could start a fresh decline if it stays below the $1,920 zone.
Ethereum Price Dips Sharply
Ethereum price failed to stay above $1,920 and started a fresh decline, like Bitcoin. ETH price traded below the $1,900 and $1,880 levels to enter a bearish zone.
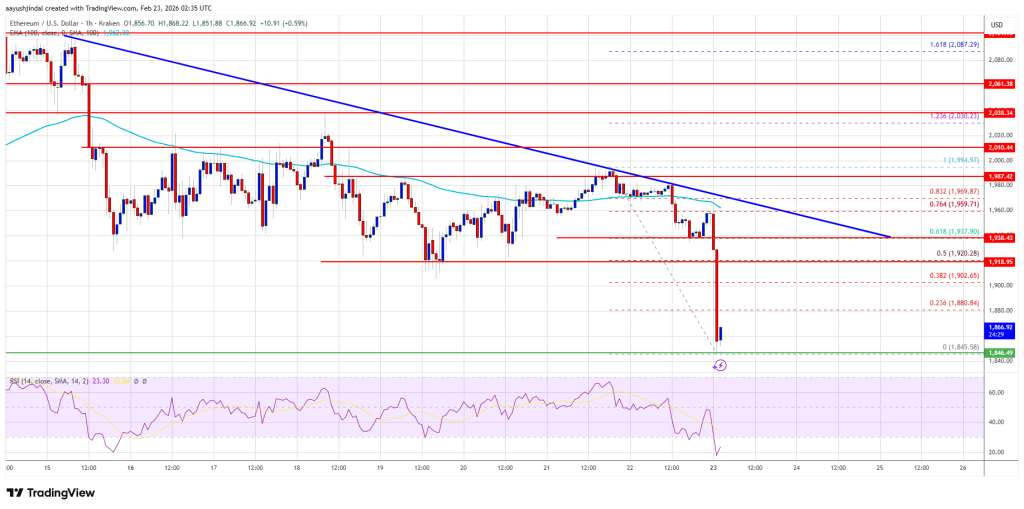
Finally, the bulls appeared near $1,850. A low was formed at $1,845, and the price started a minor recovery wave. There was a move above the $1,865 level, but the price is still well below the 23.6% Fib retracement level of the downward move from the $1,994 swing high to the $1,845 low.
Ethereum price is now trading below $1,900 and the 100-hourly Simple Moving Average. If the bulls remain in action above $1,850, the price could attempt another increase. Immediate resistance is seen near the $1,880 level.
The first key resistance is near the $1,920 level and the 50% Fib retracement level of the downward move from the $1,994 swing high to the $1,845 low. The next major resistance is near the $1,950 level. There is also a bearish trend line forming with resistance at $1,950 on the hourly chart of ETH/USD.
A clear move above the $1,950 resistance might send the price toward the $2,000 resistance. An upside break above the $2,000 region might call for more gains in the coming days. In the stated case, Ether could rise toward the $2,050 resistance zone or even $2,120 in the near term.
Another Decline In ETH?
If Ethereum fails to clear the $1,920 resistance, it could start a fresh decline. Initial support on the downside is near the $1,850 level. The first major support sits near the $1,825 zone.
A clear move below the $1,825 support might push the price toward the $1,780 support. Any more losses might send the price toward the $1,740 region. The main support could be $1,720.
Technical Indicators
Hourly MACD – The MACD for ETH/USD is gaining momentum in the bearish zone.
Hourly RSI – The RSI for ETH/USD is now below the 50 zone.
Major Support Level – $1,850
Major Resistance Level – $1,920
Related Articles

Dogecoin Breakout Mirrors Past Trend — Bigger Move Coming?
Dogecoin is showing signs of history repeating itself as a recent breakout begin...
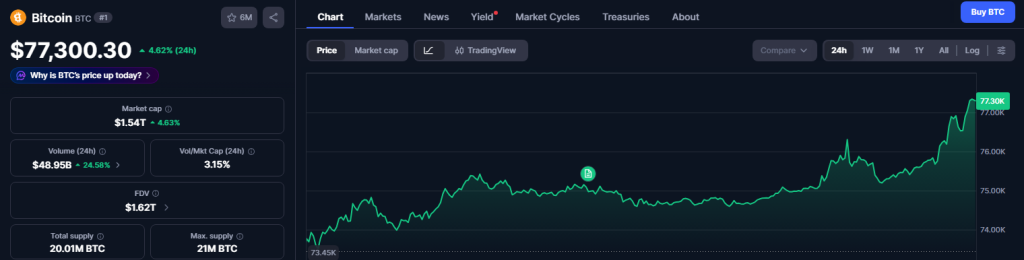
BREAKING – Bitcoin Breaks $77K As Iran Reopens Strait Of Hormuz
US President Donald Trump took to Truth Social to announce that the Strait of Ho...

Pundit Says This Chart Paints The Clearest Macro Picture For XRP
Crypto analyst Mattsby has highlighted the best chart for market participants se...
Bitcoin, Ethereum Trading Expands As Charles Schwab Enters Crypto Market
Charles Schwab is charging into the crypto space with fees lower than its closes...