Dogecoin (DOGE) Turns Soft—Bearish Signals Hint at Fresh Declines
Alex Smith
6 months ago
Dogecoin started a fresh decline below the $0.1420 zone against the US Dollar. DOGE is now consolidating losses and might face hurdles near $0.1440.
- DOGE price started a fresh decline below the $0.1420 level.
- The price is trading below the $0.1420 level and the 100-hourly simple moving average.
- There is a key bearish trend line forming with resistance at $0.1440 on the hourly chart of the DOGE/USD pair (data source from Kraken).
- The price could extend losses if it stays below $0.1420 and $0.1440.
Dogecoin Price Faces Resistance
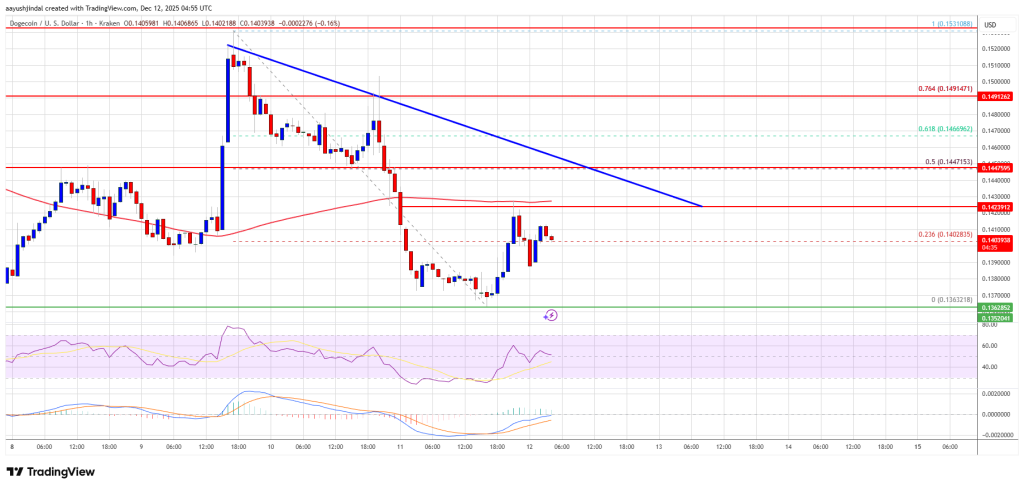
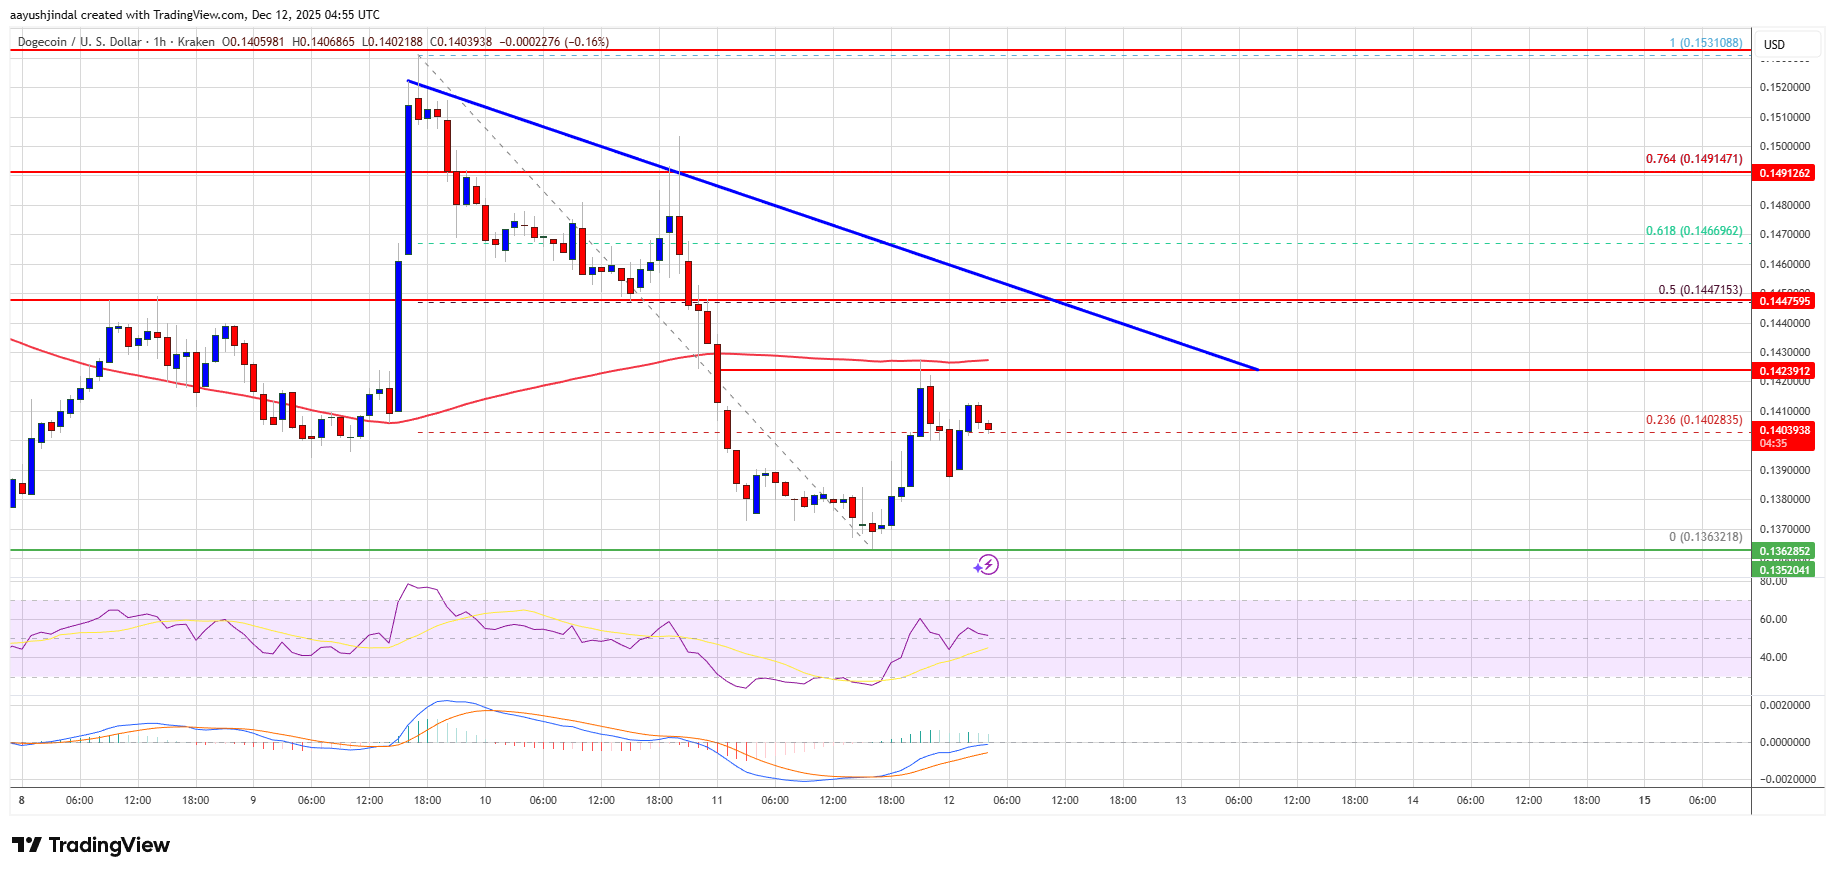
Dogecoin price started a fresh decline after it closed below $0.1465, like Bitcoin and Ethereum. DOGE declined below the $0.1440 and $0.140 support levels.
The price even traded below $0.1380. A low was formed near $0.1363, and the price recently corrected some losses. There was a minor increase above the 23.6% Fib retracement level of the downward move from the $0.1530 swing high to the $0.1363 low.
Dogecoin price is now trading below the $0.1420 level and the 100-hourly simple moving average. If there is a recovery wave, immediate resistance on the upside is near the $0.1425 level. The first major resistance for the bulls could be near the $0.1440 level. There is also a key bearish trend line forming with resistance at $0.1440 on the hourly chart of the DOGE/USD pair.
The next major resistance is near the $0.1490 level and the 76.4% Fib retracement level of the downward move from the $0.1530 swing high to the $0.1363 low. A close above the $0.1490 resistance might send the price toward the $0.1530 resistance. Any more gains might send the price toward the $0.1550 level. The next major stop for the bulls might be $0.1620.
Another Decline In DOGE?
If DOGE’s price fails to climb above the $0.1440 level, it could continue to move down. Initial support on the downside is near the $0.1380 level. The next major support is near the $0.1360 level.
The main support sits at $0.1320. If there is a downside break below the $0.1320 support, the price could decline further. In the stated case, the price might slide toward the $0.1250 level or even $0.1240 in the near term.
Technical Indicators
Hourly MACD – The MACD for DOGE/USD is now losing momentum in the bearish zone.
Hourly RSI (Relative Strength Index) – The RSI for DOGE/USD is now above the 50 level.
Major Support Levels – $0.1360 and $0.1320.
Major Resistance Levels – $0.1440 and $0.1490.
Related Articles

Bitcoin Bears Eye Lower Levels As TradingView Analysts Flag Failed Recovery
TradingView analysts warn Bitcoin's rebound may still be a resistance retest as...

Bitcoin Reclaims $63,500 As Traders Watch For Squeeze Toward $67,000
Bitcoin bulls are watching the $63,500 support zone as traders map a potential s...

Bitcoin Analysts Split Between Buyer Demand And Resistance Ceiling Near $65,000
Bitcoin analysts are split as BTC shows buyer demand but still faces a resistanc...

Bitcoin Faces Key $64,100 Resistance As Analyst Watches Fib Reaction Zone
An X analyst says Bitcoin is approaching local H4 resistance near $64,100, a lev...