Bitcoin Price’s Next Move Could Be Below $80,000 — Here’s Why
Alex Smith
6 months ago
The price action of Bitcoin has been somewhat limited in the past few weeks, as the bulls and bears battle for dominance in the market. This indecisiveness has had the premier cryptocurrency oscillating between the $89,000 and $93,000 levels in recent weeks.
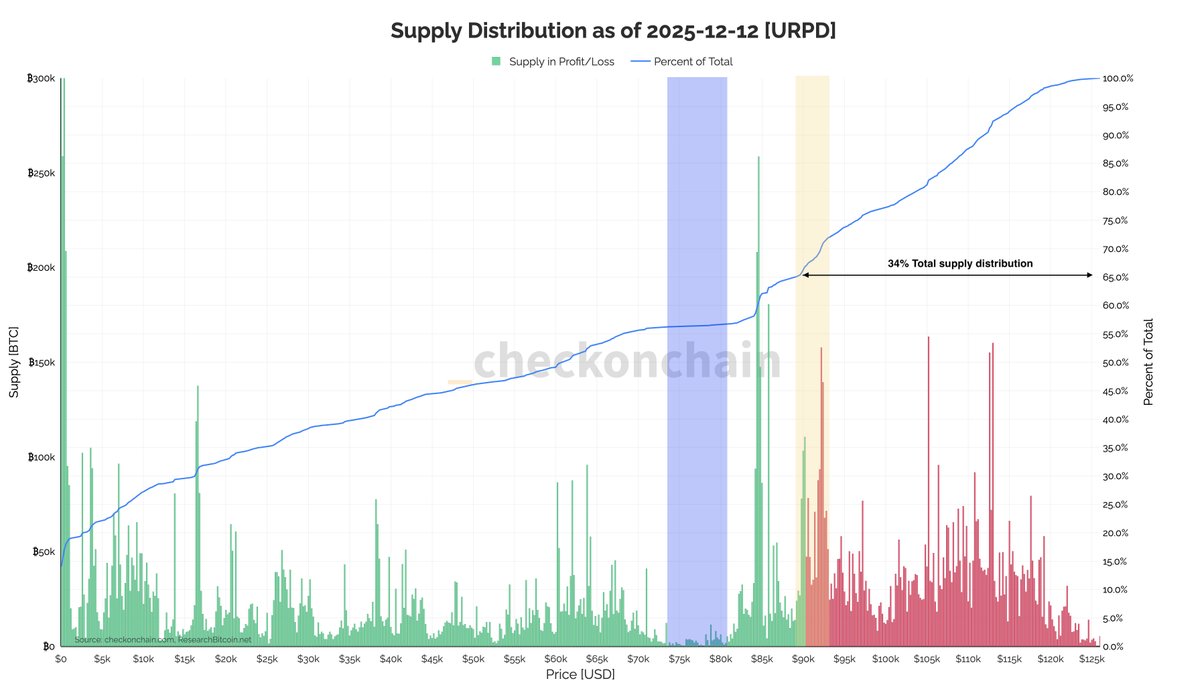
According to the latest on-chain data, this sideways movement exhibited by the Bitcoin price is associated with the uneven distribution of the coin’s total supply around various levels. This recent on-chain evaluation has also identified the possible next stop for the market leader’s price.
BTC Price At Risk Of A 20% Decline?
In a December 13 post on the X platform, pseudonymous analyst Darkfost explained that the Bitcoin price is locked in a battle between $89,000 and $93,000. This on-chain observation is based on the distribution of the BTC supply (using the URPD metric) around different price levels.
The URPD (UTXO Realized Price Distribution) metric tracks the amount of a particular cryptocurrency that was traded at a specific price level. When a large amount of coins is traded at a certain price level, the region tends to serve as support when the price trades above it and resistance when the price is beneath it.
According to Darkfost, this explains why the Bitcoin price seems stuck within the $89,000 – $93,000 region (the yellow area in the highlighted chart). The market analyst noted that the zone has seen significant trading activity, justifying the oscillation of the BTC price within the range.
What’s new is the “distribution gap” (blue area in the chart) in the $74,000 – $80,000 range, which represents a zone with relatively low historical trading activity. Darkfost explained that these low-liquidity regions tend to attract the Bitcoin price in a bid to rebalance supply and demand.
As observed in the chart above, this distribution gap lies between the $74,000 – $80,000 range, meaning that the price of BTC could witness a correction to this level before bouncing back to a new high. A correction to this level could be equivalent to a nearly 20% downturn from the current price point.
Furthermore, Darkfost noted that 34% of the total BTC supply distribution is now above the psychological $90,000 level. This trend could make $90,000 a structural support level for the price of Bitcoin over time.
It is also worth noting that while a large distribution cluster can be seen around $84,000, it should not be over-interpreted. Darkfost mentioned that the distribution level is not as genuine as it looks, but rather a result of Coinbase’s recent Bitcoin movement.
Bitcoin Price At A Glance
As of this writing, the price of BTC stands at around $90,150, reflecting no significant change in the past 24 hours.
Related Articles

Bitcoin Bears Eye Lower Levels As TradingView Analysts Flag Failed Recovery
TradingView analysts warn Bitcoin's rebound may still be a resistance retest as...

Bitcoin Reclaims $63,500 As Traders Watch For Squeeze Toward $67,000
Bitcoin bulls are watching the $63,500 support zone as traders map a potential s...

Bitcoin Analysts Split Between Buyer Demand And Resistance Ceiling Near $65,000
Bitcoin analysts are split as BTC shows buyer demand but still faces a resistanc...

Bitcoin Faces Key $64,100 Resistance As Analyst Watches Fib Reaction Zone
An X analyst says Bitcoin is approaching local H4 resistance near $64,100, a lev...