Bitcoin Price In Freefall As Panic Sweeps Through The Market
Alex Smith
2 weeks ago
Bitcoin price started a fresh decline below the $70,000 zone. BTC is consolidating and might continue to move down if it dips below $66,000.
- Bitcoin failed to stay above $70,500 and extended losses.
- The price is trading below $70,000 and the 100 hourly simple moving average.
- There is a bearish trend line forming with resistance near $68,000 on the hourly chart of the BTC/USD pair (data feed from Kraken).
- The pair might extend losses if it stays below the $67,500 and $68,500 levels.
Bitcoin Price Nosedives
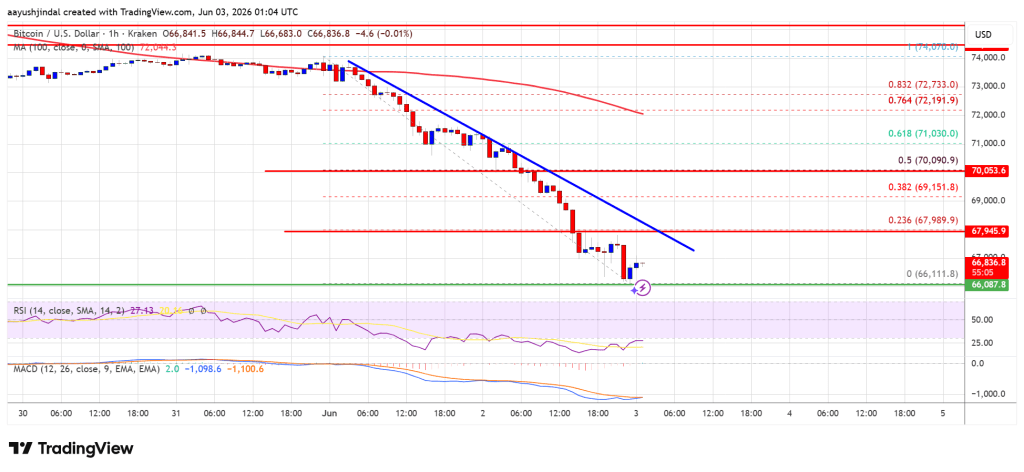
Bitcoin price failed to stay above the $72,000 support zone. BTC remained in a bearish zone and extended losses below the $70,500 level. There was a move below the $70,000 level.
The price even dipped below $67,200. A low was formed at $66,111 and the price is now consolidating losses with a bearish angle below the 23.6% Fib retracement level of the downward move from the $74,070 swing high to the $66,111 low.
Bitcoin is now trading below $70,000 and the 100 hourly simple moving average. If the price remains stable above $66,000, it could attempt a fresh increase. Immediate resistance is near the $68,000 level. There is also a bearish trend line forming with resistance near $68,000 on the hourly chart of the BTC/USD pair.
The first key resistance is near the $68,500 level. A close above the $68,500 resistance might send the price further higher. In the stated case, the price could rise and test the $70,000 resistance and the 50% Fib retracement level of the downward move from the $74,070 swing high to the $66,111 low. Any more gains might send the price toward the $71,500 level. The next barrier for the bulls could be $72,000.
Downside Acceleration In BTC?
If Bitcoin fails to rise above the $70,000 resistance zone, it could start another decline. Immediate support is near the $66,200 level.
The first major support is near the $66,000 level. The next support is now near the $65,000 zone. Any more losses might send the price toward the $64,200 support in the near term. The main support now sits at $63,500, below which BTC might struggle to recover in the near term.
Technical indicators:
Hourly MACD – The MACD is now gaining pace in the bearish zone.
Hourly RSI (Relative Strength Index) – The RSI for BTC/USD is now below the 50 level.
Major Support Levels – $66,000, followed by $65,000.
Major Resistance Levels – $68,000 and $70,000.
Related Articles

Zcash Fixes Critical Orchard Vulnerability As ZEC Holds $600 Support
Zcash has patched a dangerous vulnerability in its privacy-focused infrastructur...

Bitcoin Falls Below $66K As Short-Term Holder Stress Reaches February Levels
Bitcoin has lost the $66,000 level as selling pressure and uncertainty intensify...

XRP Already Powers Real Banking Activity, Says Evernorth, With More Growth Expected
Evernorth says daily activity on the XRP Ledger has climbed to nearly 3 million...
Crypto Is A ‘Failed’ Asset Class, Says Renowned Economist
Economist and macro trader Alex Krüger has argued that “crypto” has largely fail...