Bitcoin Price Enters Next Parabolic Phase, Analysts Set New Targets
Alex Smith
4 months ago

The recent market downturn has not deterred analysts from maintaining a bullish outlook on the Bitcoin price. New reports from these market watchers suggest Bitcoin may be entering a new parabolic phase, potentially signaling the end of its prolonged correction. While one analyst points to BTC’s correlation with gold as a signal of a possible ATH, another applies an Elliott Wave analysis to set a new price target for the leading cryptocurrency.
Bitcoin Price Prepares For $245,000 Parabolic Move
A recent technical analysis by Crypto Tice suggests that gold has taken the lead, while Bitcoin currently stands at a transition point. The analyst presented a weekly price chart tracking both assets, and showing how gold’s price movement could be used to determine Bitcoin’s next parabolic move to a $245,000 all-time high.
The chart tracks gold and Bitcoin’s price action from 2016 through projected moves into 2026, showing a repeating pattern where uncertainty peaks in gold first. After which, capital flows into the precious metal, its price then breaks out and ranges, and then money rotates into BTC. Crypto Tice has said that this rotation phase has repeated in every market cycle.
In the first cycle, from July 2017 to Q4 2018, gold climbed to an all-time high before trading in a narrow range, signaling broader trend exhaustion rather than a breakdown. Shortly afterward, Bitcoin launched a strong rally, reflecting a rotation of capital from the precious metal into a higher-risk asset.
The same pattern appeared during the 2020-2021 cycle. Gold reached a new peak and stalled in a tight range, while Bitcoin followed with a powerful breakout to the upside. That surge aligned with another green profit rotation zone on the analyst’s price chart.
On the far right side of the chart, Crypto Tice has revealed that gold has once again reached a record high in the current cycle and is consolidating inside a red range. At the same time, Bitcoin has already moved sharply higher and is now experiencing a modest pullback. The analyst calls this overlap a “transfer window” between the two assets.
Crypto Tice noted that this recent pause mirrors the same pattern seen in past cycles before Bitcoin staged a major price rally. The analyst has predicted that if BTC continues to follow this historical trend, it could soon enter a new parabolic phase, potentially triggering a price surge above $245,000.
Elliott Wave Analyst Shares Next BTC Price Target
In a separate analysis, crypto market expert Merlijn the Trader has shared a video chart analysis showing a repeating Elliott wave structure that could indicate Bitcoin’s next potential bullish target. From late 2024 to mid 2025, BTC formed a five-wave pattern, creating higher lows and building a base that led to a significant price rally.
According to Merlijn the Trader, Bitcoin is repeating this five-wave pattern in the current cycle. Waves 1 through 3 are already complete, showing higher lows, while Waves 4 and 5 are forming a base following a massive price crash. Once this stage completes, the analyst predicts BTC could rally strongly from its current price above $87,900 toward $124,000.
Related Articles
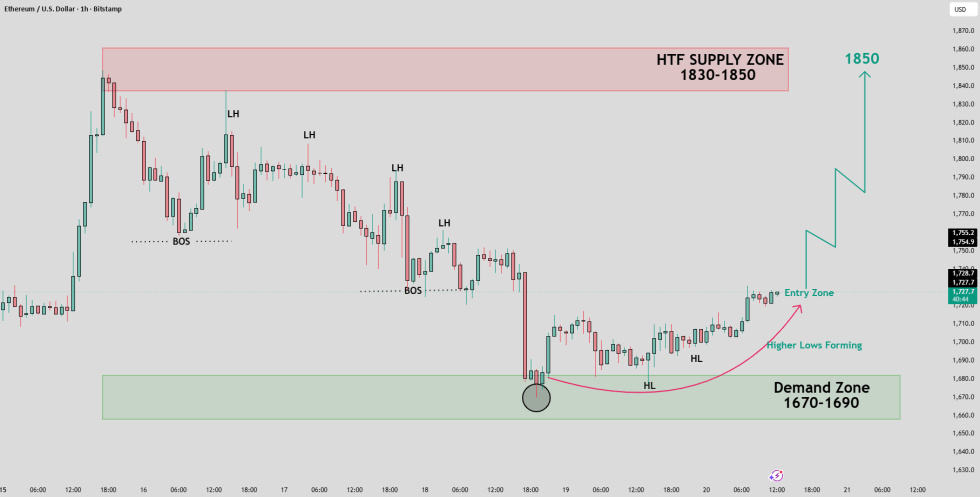
Ethereum Price Setup Targets $1,850 As Buyers Defend Key Demand Zone
A TradingView analyst says Ethereum could target $1,850 if buyers defend the $1,...
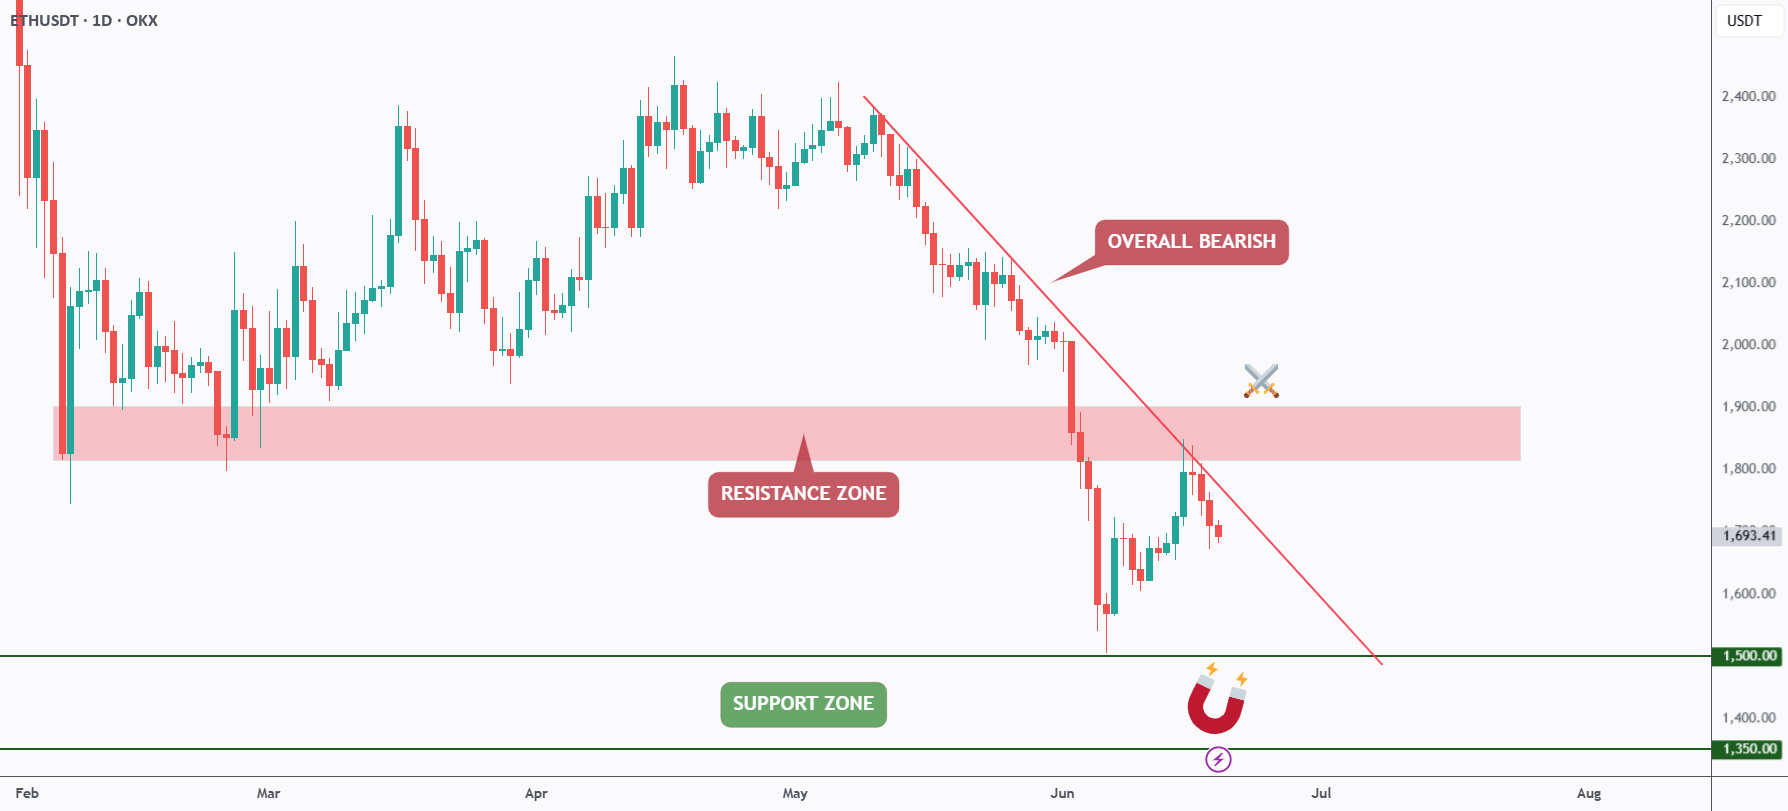
Ethereum Bears Keep Control As ETH Rejects Trendline Resistance
A TradingView analyst says Ethereum remains bearish below a falling trendline, w...
ETH/BTC Ratio Falls Back To Early-2023 Levels As Traders Debate Ethereum Value
An X analyst says ETH/BTC is back near 0.027, while a TradingView chart shows ET...
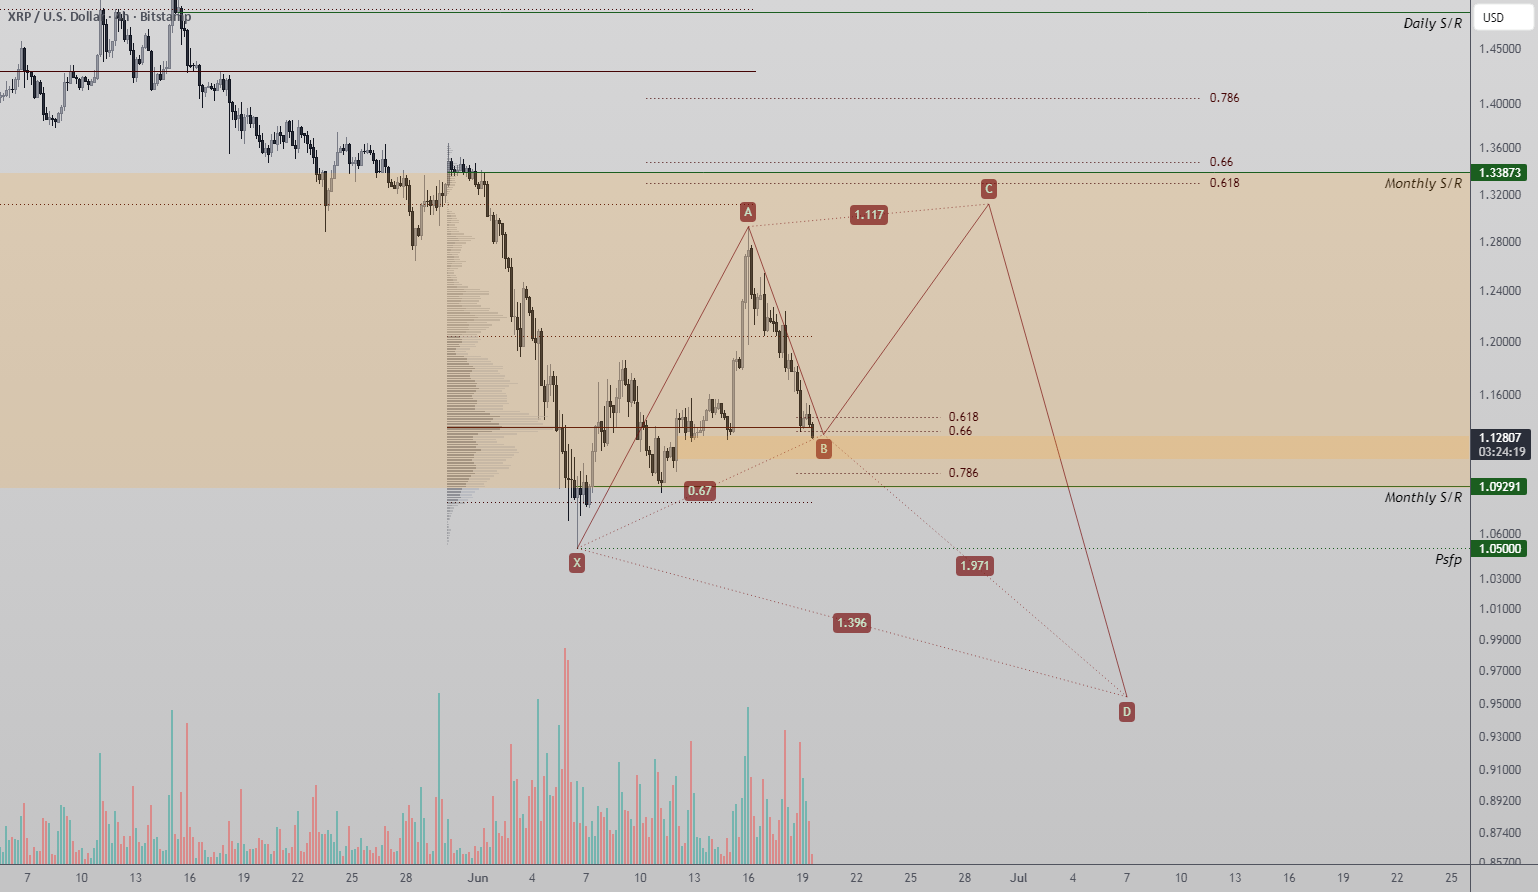
XRP Reversal Setup Forms Around Harmonic Pattern And Key Support Zone
A TradingView analyst says XRP is testing a technically important support zone s...