Bitcoin Is Repeating This Midterm Pattern That Sends Price Tumbling 15% On Average
Alex Smith
4 weeks ago
Crypto market analyst Merlijn the Trader has sounded the alarm about a recurring midterm pattern that has historically preceded major Bitcoin (BTC) price crashes. According to his analysis, this bearish signal has caused BTC’s value to drop by 15% on average. With the pattern now appearing in the current cycle, the analyst suggests that a major price correction could be on the horizon for Bitcoin.
Analyst Calls For Late-Year Bitcoin Price Bottom
In an X post on May 19, Merlijn the Trader warned investors and traders that a Bitcoin bear crash could be imminent. He pointed to a key chart pattern that has appeared in every midterm year, from as early as 2018 through the current market cycle.
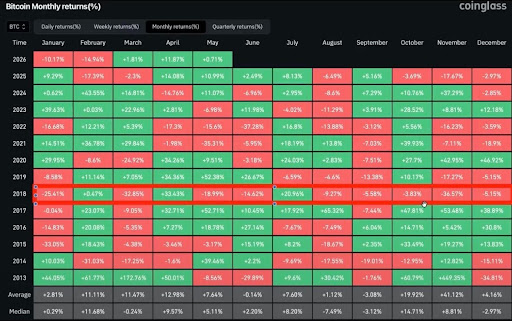
According to the analyst, the pattern follows a distinct cyclical structure, where Bitcoin experiences a significant price decline in Q1 before recovering and rallying in Q2. Once this relief rally ends, a sharp crash occurs, marking a late-year bottom for the flagship cryptocurrency.
The first time this mid-term year pattern was observed was in 2018. At the time, Bitcoin’s price fell by a staggering 25% in January, before rallying by over 33% in Q2 around April. Once this brief recovery faded, the cryptocurrency plummeted again by 19% in May, before forming a final cycle low around December of that year.
The same trend was repeated during the 2022 cycle. Here, Bitcoin’s price fell by 17% in Q1, then staged a more than 5% recovery in March, before recording a 16% decline in April and ultimately forming a cycle bottom in November.
Fast-forward to the current market cycle, Merlijn the Trader believes that Bitcoin’s price action could be mirroring this historical mid-term pattern. He noted that BTC has already experienced a massive 23% price crash in Q1, followed by a relief rally of over 14% from March to April 2026.
Now, the bullish momentum appears to be fading, with May bringing more volatility and a decline in BTC price. If history plays out as expected, Merlijn the Trader predicts that Bitcoin could form a midterm-year bottom between November and December this year. While he has not set a specific bearish target for his forecast, the analyst remains confident that a price crash could occur soon.
BTC Forecasted To Crash As Low As $37,000
Other crypto analysts like Chiefy appear to maintain a similar bearish stance on Bitcoin. In a recent X post, the expert also pointed to past trends and chart structures, noting that BTC is repeating a key pattern that has consistently destroyed bullish sentiment across past market cycles.
He described this bearish signal as “the Head & Shoulders breakdown,” noting that the pattern has already been confirmed on the BTC chart. Because of its recent re-emergence, Chiefy believes the market is now entering a retest phase and predicts a potential BTC price crash to $37,000. With Bitcoin currently trading above $77,000, a decline to this level would represent a more than 52% loss in value.
Related Articles
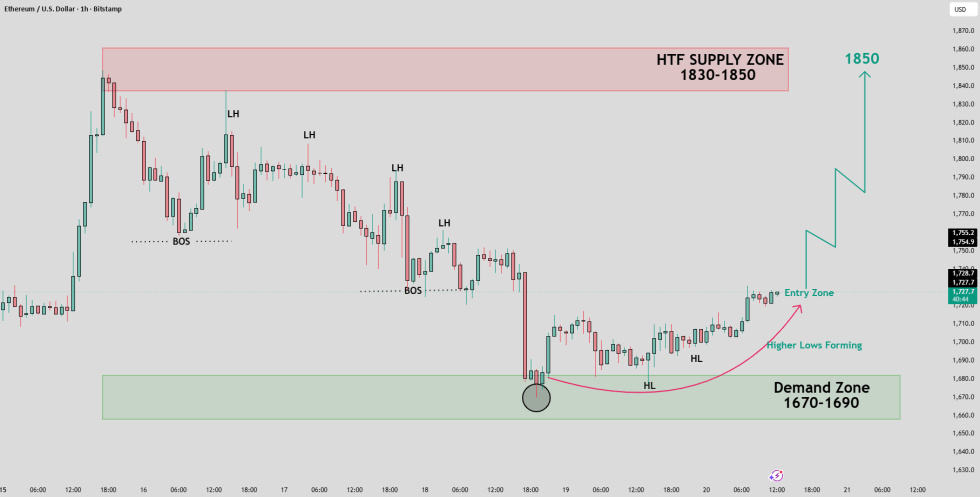
Ethereum Price Setup Targets $1,850 As Buyers Defend Key Demand Zone
A TradingView analyst says Ethereum could target $1,850 if buyers defend the $1,...
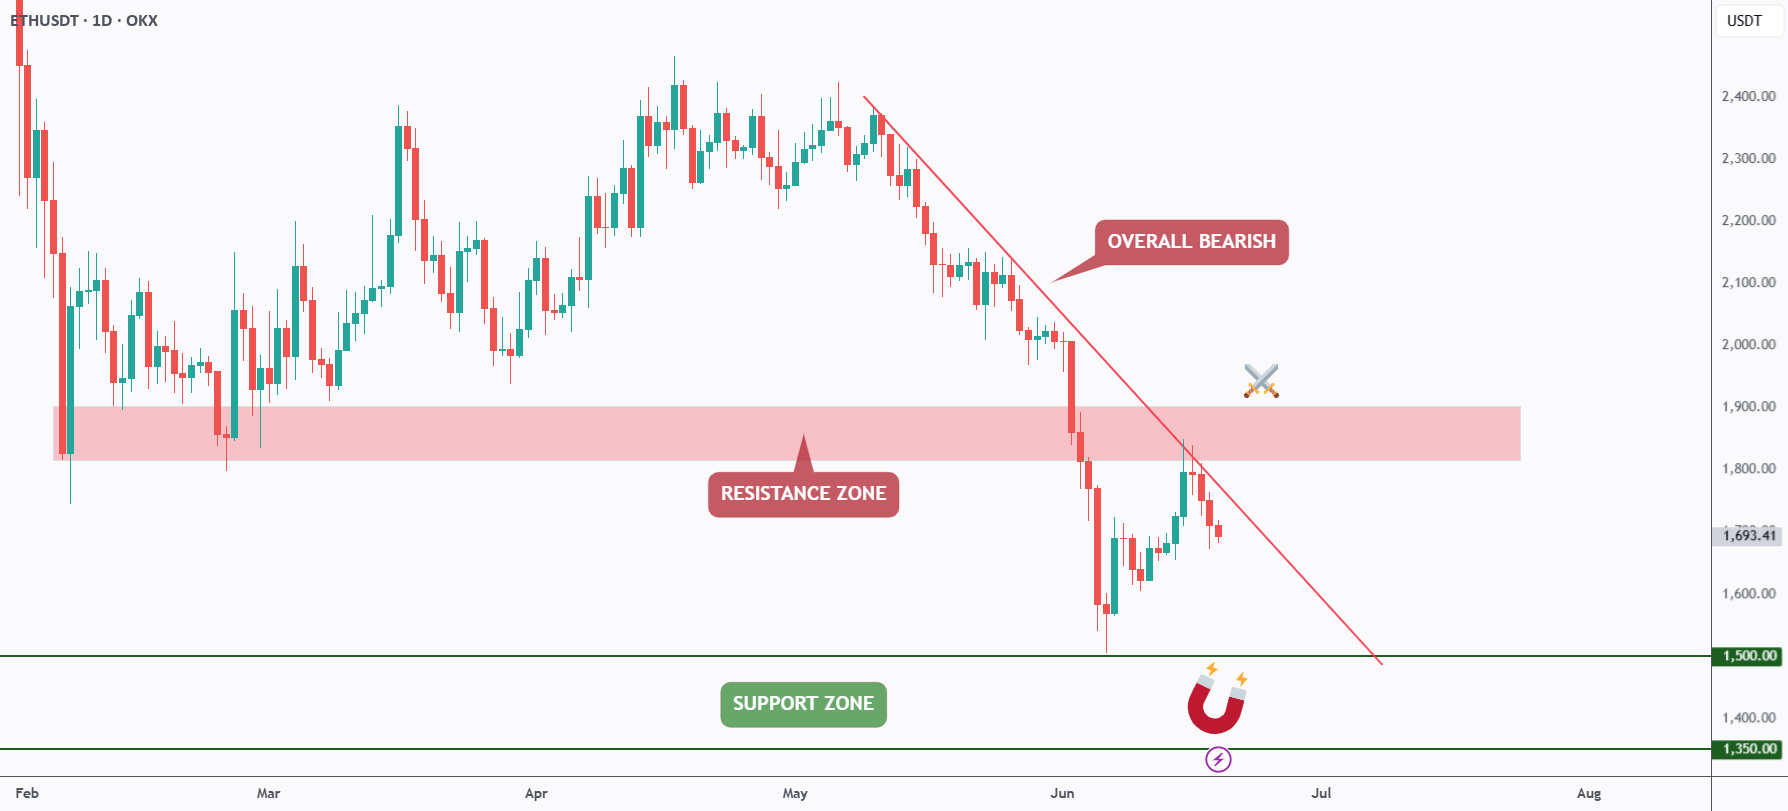
Ethereum Bears Keep Control As ETH Rejects Trendline Resistance
A TradingView analyst says Ethereum remains bearish below a falling trendline, w...
ETH/BTC Ratio Falls Back To Early-2023 Levels As Traders Debate Ethereum Value
An X analyst says ETH/BTC is back near 0.027, while a TradingView chart shows ET...
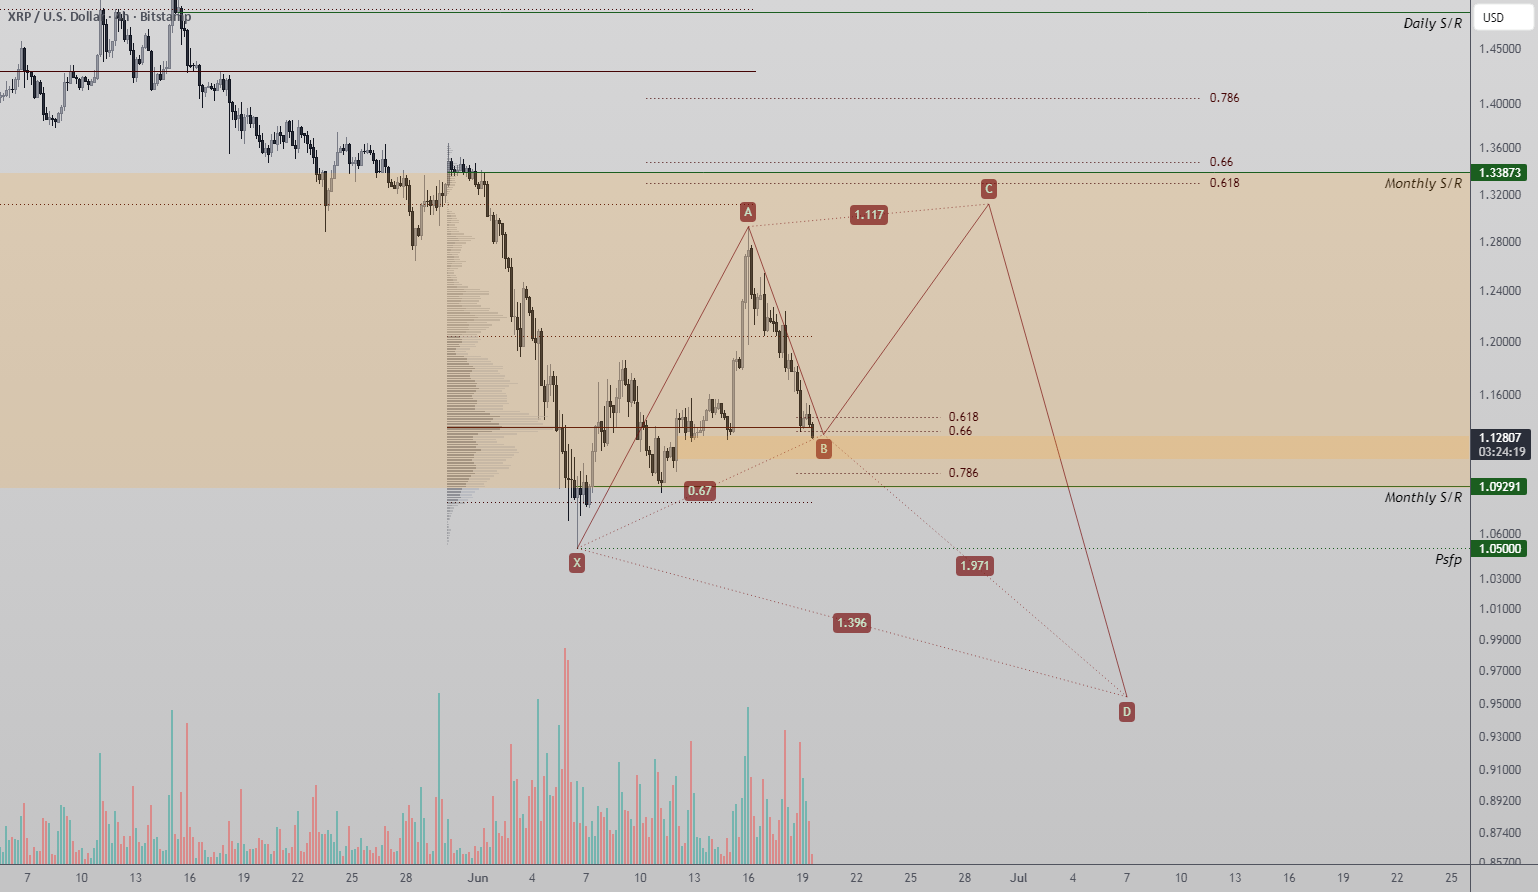
XRP Reversal Setup Forms Around Harmonic Pattern And Key Support Zone
A TradingView analyst says XRP is testing a technically important support zone s...