Bitcoin Correction Accelerates Toward Historic Capitulation Zone – Details
Alex Smith
4 months ago

Bitcoin is struggling to hold the $70,000 level as the market shows clear signs of weakening demand following weeks of sustained selling pressure. After several failed recovery attempts, price action continues to reflect fragile sentiment, with liquidity thinning and volatility increasing. Investors remain cautious as macro uncertainty, declining risk appetite, and persistent outflows from speculative assets weigh on the broader crypto market.
A recent analysis from Axel Adler indicates that the bear market underway since November 2025 has entered a deeper phase following last Friday’s sharp decline, which pushed total drawdown to roughly 46% from the cycle peak. This magnitude of correction historically marks a transition from an early pullback into a more mature bearish stage, where sentiment typically deteriorates further before stabilization occurs.
The report highlights that Bitcoin has approached the 1.25× Realized Price Band, a historically significant level that often separates standard corrections from capitulation phases. When price tests this boundary, market structure tends to become highly sensitive to liquidity shifts and investor positioning.
Whether Bitcoin can hold above this zone will likely determine the short-term direction. A sustained breakdown could signal deeper capitulation dynamics, while stabilization may provide the foundation for eventual accumulation.
Bear Market Drawdown Signals Transition Into Deeper Phase
Adler notes that the Bitcoin Bear Market Correction Drawdowns chart places the current 2025–2026 decline in historical context, comparing its magnitude with previous bear cycles. The metric tracks percentage drawdowns from each cycle’s all-time high on a logarithmic scale, allowing a clearer assessment of structural market stress rather than nominal price moves alone.
The current bear phase began after Bitcoin topped near $124,450 in October 2025. By November, the market had entered a persistent downtrend, with the correction expanding from roughly −20% to −30% initially before accelerating to around −46% by early February. Notably, the pace intensified sharply: the drawdown moved from approximately −28% on January 28 to −46% by February 6. A modest rebound followed, with price briefly stabilizing near $70,700, still implying a drawdown of roughly −43%.
Historically, earlier cycles saw significantly deeper declines, including roughly −93% in 2011, around −83% in both the 2013–2015 and 2017–2018 bear markets, and about −76% during the 2021–2022 correction. Against that backdrop, the current decline appears less severe so far.
Adler argues that three months of persistent downside momentum signal entry into a deeper corrective phase. Stabilization between −40% and −50% would suggest moderating cycle volatility, while a drop beyond −50% could reopen downside targets toward the −60% to −70% range.
Bitcoin Tests Critical Support As Downtrend Pressure Intensifies
Bitcoin’s latest price action shows a clear deterioration in market structure after the sharp breakdown toward the $65K–$70K region. The chart highlights a decisive loss of short-term support, followed by an aggressive selloff that pushed price well below the key moving averages, signaling sustained bearish momentum rather than a simple correction.
Notably, BTC is trading under the 50-, 100-, and 200-period moving averages, all of which are beginning to slope downward. This alignment typically reflects a transition from consolidation into a more established downtrend. The rejection near the mid-$90K area earlier in the cycle appears to have confirmed a lower high, reinforcing bearish continuation risk.
Volume dynamics also deserve attention. The sharp spike during the most recent drop suggests forced selling, likely driven by liquidations and panic positioning. Historically, such spikes can either mark capitulation or precede further downside if follow-through selling emerges.
From a structural perspective, the $65K zone is now critical. Holding above it could allow stabilization and a potential relief bounce. However, a sustained breakdown below this level would likely expose the next demand region closer to the low-$60K range, where stronger historical support may emerge.
Featured image from ChatGPT, chart from TradingView.com
Related Articles
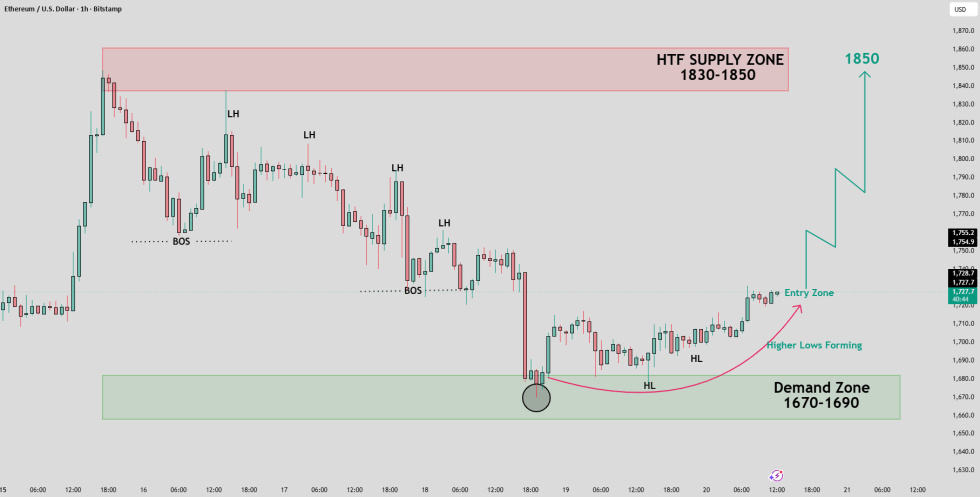
Ethereum Price Setup Targets $1,850 As Buyers Defend Key Demand Zone
A TradingView analyst says Ethereum could target $1,850 if buyers defend the $1,...
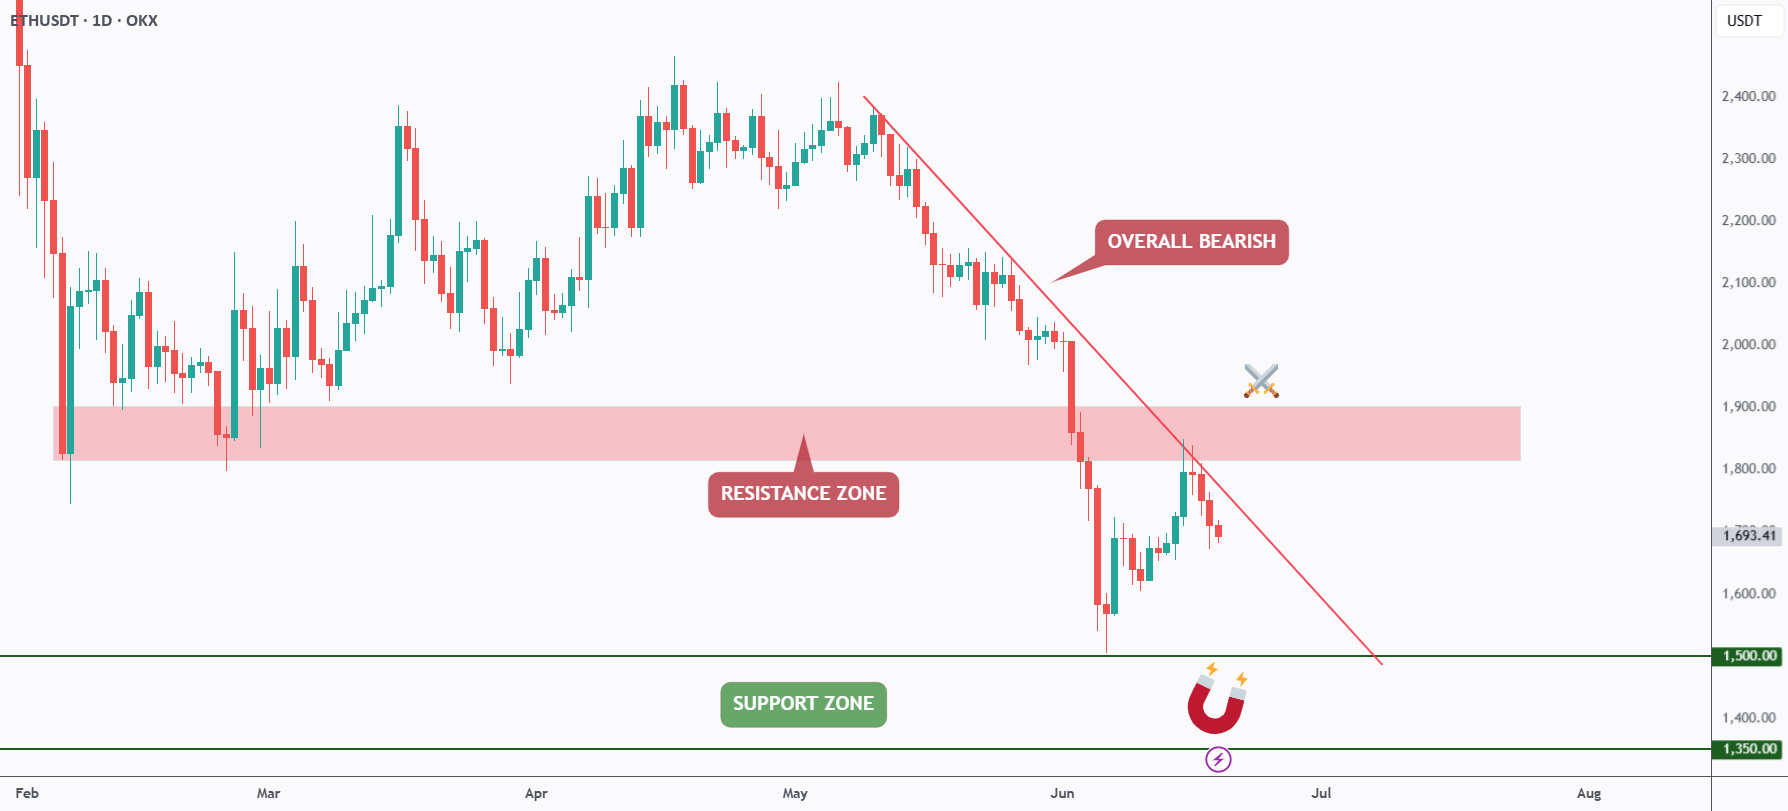
Ethereum Bears Keep Control As ETH Rejects Trendline Resistance
A TradingView analyst says Ethereum remains bearish below a falling trendline, w...
ETH/BTC Ratio Falls Back To Early-2023 Levels As Traders Debate Ethereum Value
An X analyst says ETH/BTC is back near 0.027, while a TradingView chart shows ET...
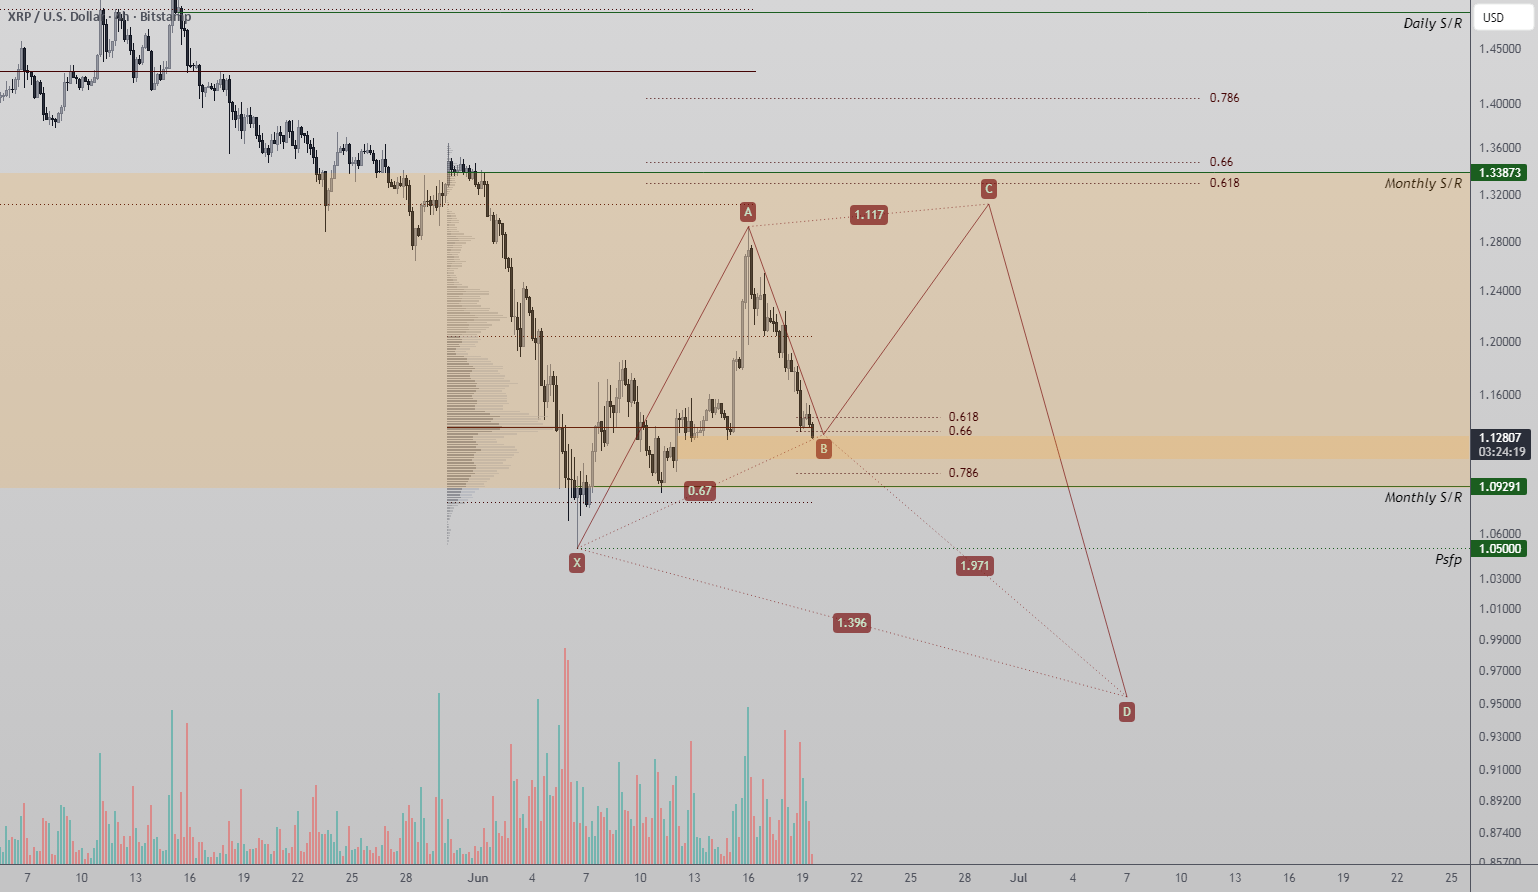
XRP Reversal Setup Forms Around Harmonic Pattern And Key Support Zone
A TradingView analyst says XRP is testing a technically important support zone s...